Inform | Influence | Empower

Website Search:

News

Q1 Econ Report: Spring Market Shows Growing Inventory Amid Stable Prices

04/28/2026

The first quarter of 2026 for the Madison County residential real estate market was characterized by modest growth in sales and pricing, suggesting a continued normalization and a move toward more balanced market conditions.

Market Performance Highlights

  • Home Sales: A total of 1,584 homes were sold in Q1 2026, a 1.8% increase compared to Q1 2025.
     
  • Pricing Trends: The median sales price reached $332,884, a 2.5% year-over-year increase and the highest first-quarter level on record for the region.
     
  • Inventory & Supply: While the 2,394 homes available for sale in March 2026 marked a high for the year, overall inventory was down 5.5% compared to March 2025. The market currently holds a 4.4-month supply, moving closer to a balanced state.
     
  • Days on Market (DOM): Homes averaged 64 days on the market, which is unchanged from Q1 2025 but represents a 21% increase from the previous quarter (Q4 2025).

Segment-Specific Insights

  • New Construction vs. Existing Homes: New construction continues to be a major market driver, accounting for 36% (569 units) of all Q1 sales.
     
  • Price Range Shifts: The most significant growth occurred in the $500K–$650K price range, where sales rose by approximately 26%. Conversely, the largest decline was seen in the $200K–$250K range, with sales falling by roughly 21%.
     
  • Sales vs. List Price: Only 13% of homes sold above their list price, while 48% closed below the initial asking price.

Broader Economic Context

  • Mortgage Rates & Inflation: The national average for a 30-year fixed mortgage was approximately 6.2% in March 2026. Regional price growth (2.5%) remained largely in line with the quarterly inflation rate of 2.7%.
     
  • Outlook: Based on current trends, sales are projected to potentially rise to around 2,000 units in Q2 2026, with ending inventory expected to reach approximately 2,500 listed homes.
Read More

Annual and Q4 Real Estate Economics Report

02/17/2026

Huntsville Real Estate: 2025 Year in Review & Q4 Insights

As we close the books on 2025, the Madison County housing market has demonstrated remarkable resilience. Despite a landscape of elevated mortgage rates, our local economy continues to drive steady demand, leading to a year of modest growth and market normalization.

2025: A Year of Steady Recovery

Total home sales for the year reached 7,284 units, a 1.8% increase over 2024. This upward trend signals a continued recovery from the market lows of 2023.

Key Annual Highlights:

Total Sales Volume: The market saw nearly $2.8 billion in total dollar volume for the year.
Pricing Stability: The median sales price for 2025 settled at $332,129, showing almost no change from the previous year, suggesting a period of price leveling.
Inventory Expansion: Average total inventory rose by approximately 11%. Notably, existing home inventory surged by 28%, while new construction inventory saw an 8% decline.
Market Pace: Homes spent an average of 54 days on the market, a 23% increase from the 44-day average in 2024.

Q4 Snapshot: A Balanced Finish

The fourth quarter saw 1,726 homes sold, holding steady compared to Q4 2024. While the pace slowed slightly from the third quarter, the market remains 3.6% above the three-year average for Q4.

Quarterly Quick Stats:

Median Price: Rose slightly to $333,450 in Q4.
Buyer’s Opportunities: Market conditions leaned toward buyers, with 36% of homes selling below list price and only 17% closing above list.
New Construction: Accounted for 31% of total closings during the quarter.
Inventory Shift: Total active listings at the end of December stood at 2,270, a slight 3.3% decrease from the end of 2024.

Growth by Price Segment

Activity varied significantly across different price points. The most active segment remained homes priced between $350,000 and $500,000, accounting for 25% of all transactions in 2025. Interestingly, the high-end market (homes above $800,000) saw the strongest Q4 growth, with a 26% increase in units sold compared to the same period last year.

The Bottom Line

While the days of rapid price appreciation and record-low mortgage rates have transitioned, the Madison County market is finding its footing in a “new normal”. Strong local economic conditions and consistent demand continue to offset the impact of higher borrowing costs.
As we move into 2026, these trends toward increased inventory and stabilized pricing offer a more balanced environment for both buyers and sellers.

 
Read More

Q3 Report: Market Stabilization Continues Amid Price Dip and Higher Days on Market

11/04/2025

The Madison County residential real estate market continued its stabilization trend in the Third Quarter of 2025, according to the latest report from the Huntsville Area Association of REALTORS® (HAAR). While sales volume remained largely flat, the market saw notable shifts in median price and time on market.

Key Takeaways from Q3 2025:

  • Median Sales Price Decreased: The median sales price slightly decreased by 2.1% year-over-year, settling at $330,000, down from $336,995 in Q3 2024. This marks the second median price decline in the last three years as the market adjusts.
  • Sales Volume is Flat: A total of 1,961 homes sold, representing a slight 0.5% decrease from Q3 2024. The total sales figure is still 2.1% higher than the three-year third-quarter average.
  • Days on Market Increased: Homes spent more time on the market, with the Average Days on Market rising to 51 days, a notable increase from 39 days in Q3 2024.
  • Inventory is Down: Total units on the market at the end of September 2025 stood at 2,427, an 7.8% decline from the previous year. However, the Months of Supply for all homes remained unchanged at 4.0 months compared to Q3 2024.
  • Pricing Trends Normalize: Sales above the list price dropped to 16%, while 36% of homes sold below the asking price.
  • Mortgage Rate: The 30-year fixed mortgage rate was noted at 6.3% in the week ending September 2025.
  • Most Active Segment: The $350,000–$500,000 price range recorded the most sales, accounting for 24% of all transactions.
Read More

Q1 Real Estate Economics Report is Here!

05/20/2024

In partnership with the UAH Center for Management & Economic Research, the Huntsville Area Association of REALTORS® has released its 2024 Q1 Real Estate Economics Report, which reflects key indicators in our unique local housing market.

2024 Q1 Recap:

  • Average ‘Days on Market’ increased to 44 days. That is 33% more than the 33 days in Q1 2023 and 35% more than 2023 average (31 days).
  • Average number of available homes rose across all price ranges except the $650-$800k price band compared to 1Q 2023.
  • Sales of homes priced below $250,000 continued to decline in 1Q 2024 compared to 1Q 2023, 1Q 2022 levels.
  • Months of supply for all homes is 3.6 months, over 24% more than 1Q 2023 value.
  • A total of 1,459 units sold in 1Q 2024 in Madison County.
  • Median sales price slightly decreased to $325,000.
  • Inflation rate rose to 3.5% in March 2024 compared to 3.2% in Feb 2024.
Read More

Annual Economics Report: Nearly 10,000 Homes Sold in 2021

01/28/2022

A Decade of Growth

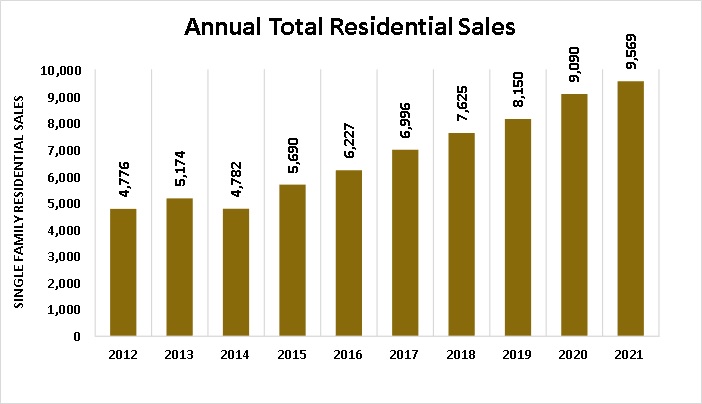
The strength of the local economy is reflected in the residential real estate market of Madison County, Alabama. Since 2012 the number of homes sold, and the home median sales price have trended higher in an annual seasonal pattern. The number of homes sold annually has doubled from 4,776 in 2012 to 9,569 in 2021.
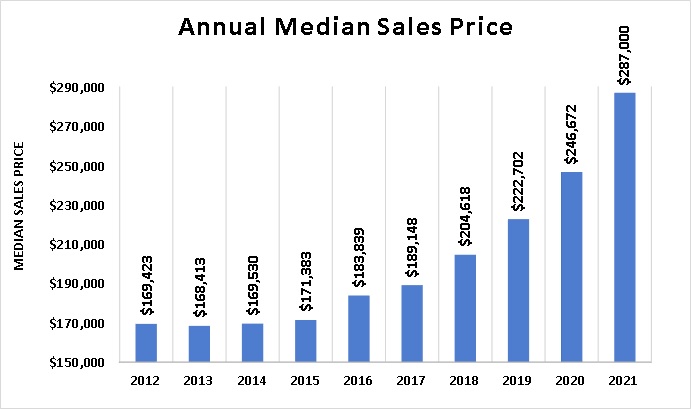
The median sales price grew approximately 70% during the same period to an annual level of $287,000.
By comparison, the U.S. inflation has fluctuated from 1.7% in 2012 to a low of 0.7% in 2015 to about 7% in 2021 which suggests that the rise in home prices resulted from increasing demand.
FIGURE 1
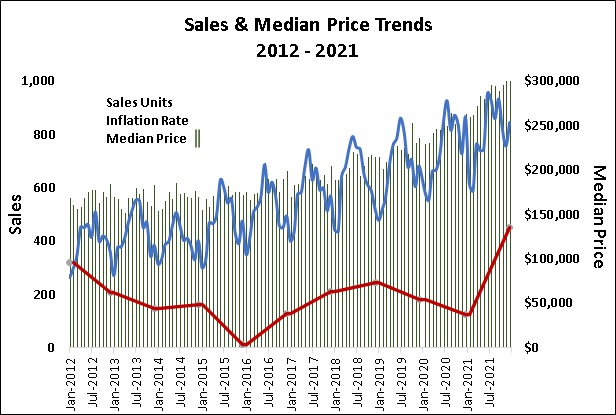
Figure 1 shows the seasonal sales pattern (blue line) of highs during the summer and lows during the winter months.  The monthly median sales price (columns) fluctuated month-to-month prior to 2020 but grew more consistently during 2021 and significantly above the inflation rate (red line).  The decline in the homes-for-sale inventory coupled with a population growth of over 50,000 since 2012 have been significant contributors to the higher home prices.  Strength in home sales and price levels should continue in the near term as Madison County welcomes new employers and residents.

2021 Annual Recap

Prices (median) for residential real estate in Madison County reached new monthly highs nine times during 2021.  Rising prices had minimal impact on housing demand based on the homes sold and the average days-on-market falling to single digits.  Annual home sales of 9,569 was an all-time high with a record monthly sales level (956) occurring in June.
The grand total of all sales grew to $3.1 billion in 2021, 21% above the $2.5 billion of 2020.  Existing home sales totaled $2.1 billion and new construction sales reached $961 million with condos & townhomes jumping 57% to $38 million during 2021.  See Figure 2.
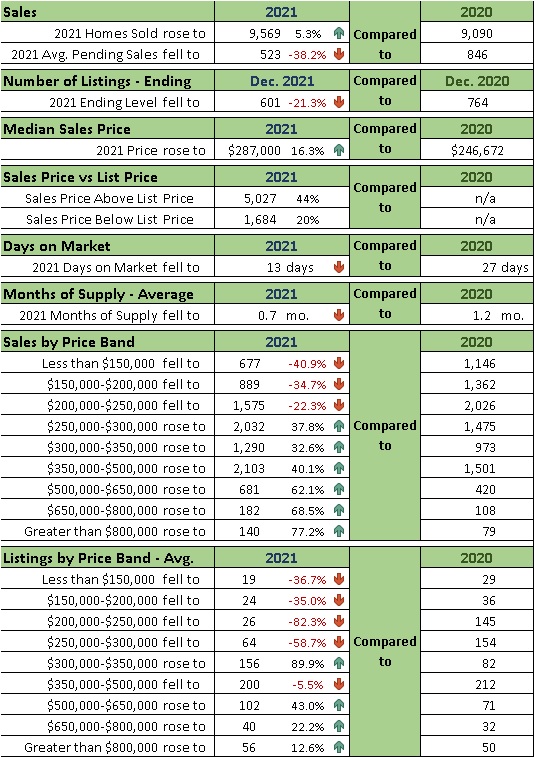
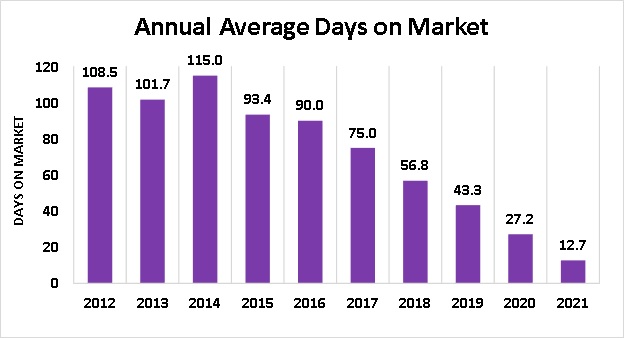
The 9,569 properties sold had an average days-on-market (DOM) of 13 days compared to 27 days last year and 90 days in 2016.  The median sales price rose 16.3% to $287,000, higher than the 2020 level.  There were approximately 9,730 new listings during the year.  By the end of 2021, there was only 0.7 months (21 days) of supply. For perspective, convention suggests that a balanced market has a 6-month supply of homes.
Sales Volume
Sales volumes increased in three quarters of 2021 relative to 2020.


Inventory of Homes Listed
The number of homes available continued to fall in 2020 hitting a low of 460 in May and climbing to 601 by year-end which was down 21.3% from Dec. 2020. The positive trend in newly constructed homes continued from 2020 to a monthly average of 230.


Days-on-Market
Average days-on-market for 2021 was 13 days, less than half of the 27 days-on-market in 2020.


Prices
The median sales price of all homes sold grew 16% to $287,000, a record annual median sales price level. By Price Band, sales for homes priced below $250,000 fell 31%. Homes priced below $150,000 fell 41% from 2020 levels. Sales of homes priced above $800,000 rose 77%. The greatest number of homes sold were priced between $350,000 and $500,000.
TABLE 1
Listings of homes available for sale dropped dramatically in the lower price-bands. The largest average number of homes listed for the year was for homes priced between $300,000 – $350,000. Inventory of homes for sale improved for homes priced above $500,000. See Table 1.
Units Sold: The total number of residential units sold in 2021 (9,569) increased 5.3% from 2020 and 100% from 2012.  The annual number of units sold has risen each year since 2012 except for the small decline in 2014.  See Figure 2.
FIGURE 2
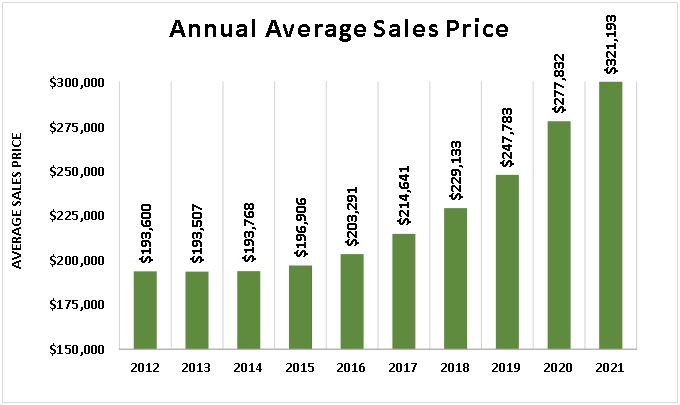
Sales Price Levels: Sale price levels rose more in 2021 than in any year since 2012.  The annual average sales price reached $321,193 in 2021, up 15.6% from 2020, a record one-year increase.  Since 2012, the average sales price has increased 66% from the 10-year low of  $193,507.  See Figure 3.
FIGURE 3
The median sales price represents the price point at which about 4,785 homes sold at a lower price and 4,785 homes sold at a higher price in 2021.  Annual median levels rose throughout the decade, up 70% since the low in 2013.  The 2021median price rose 16% to $287,000 from the 2020 level.  See Figure 4.
FIGURE 4
Average Days On Market: Number of days-on-market (DOM) is a measure of the length of time a home is listed for sale.  In 2021, the average days-on-market fell to an average of 12.7 days for the year.  A falling DOM may suggest a rising demand or a falling supply, or both which occurred in 2021.  See Figure 5.
FIGURE 5
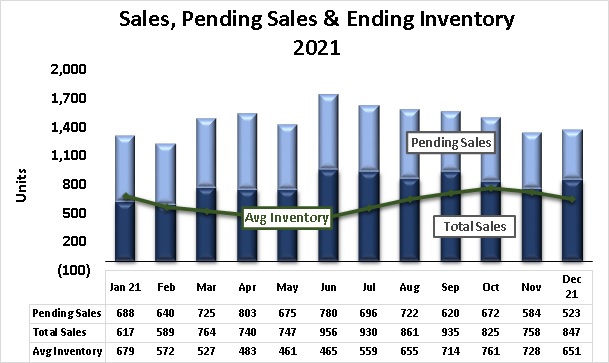
Sales & Inventory: Home sales for the year totaled  9,569 with the peak in June.  The total number of  monthly sales  exceeded the average number of listed homes every month except January in 2021.  The monthly average inventory was greatest in October at 761 homes. See Figure 6. 
Total pending sales peaked in April at 803 but was stable for the year. 

Executive Summary

Residential real estate in Madison County, Alabama reflected the strength of the local economy with records levels of home and prices.   Inventory of listed homes continued to shrink but the number of newly constructed homes coming on market increased 3% despite the supply chain and labor force challenges during the year. 
The increases in home prices pushed sales and the inventory of listed homes into higher price bands resulting in fewer homes available in the under $250,000 price ranges.  This shift toward higher housing prices affects local housing affordability and accessibility.  Fortunately, the strong local growth in good-paying jobs should help first-time home buyers at least in the near term.
Madison County home demand and supply should continue to grow, at least near-term, barring a shock from a significant economic event, interest rate hike, further supply chain shortages, etc.    
The anticipated growth may be centralized in but not limited to Madison County.  Contiguous counties in Alabama and Tennessee will likely experience similar housing market affects further highlighting the connectivity of the regional economy.
 
Read More

Annual Economic Report Recaps a Great Year, Identifies Challenges for 2020

03/13/2020

If you would like your company’s branding placed on this report to distribute to your clients or colleagues, please email Daniela Perallon your request with a high resolution logo at Daniela@valleymls.com.
2019 Annual Report

This year, October was the peak month for the lowest average time houses stayed on market, at 31 days. Although that time has increased slightly toward the end of the year, 2020 is expected to hover around the annual average in the first quarter of next year. 2020 will also see lower inventory than the 993 listings seen on December 31.

Although housing prices are rising at manageable rates with an improving economy, costs could increase at a higher rate in 2020 because of further dwindling inventory and higher-income families expected to move into the region in the year to come.

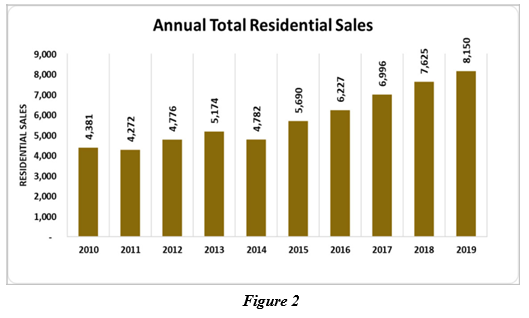
Residential real estate in Madison County reached new heights of success in 2019 with total sales of $2.0 billion up from the previous high in 2018 of $1.75 billion. There were 8,150 properties sold in an average of only 43 days-on-market (DOM) compared to 57 last year. Median sales price continued to climb to $222,702 an increase of 8.8% over 2018 and up 30% since 2015. There were approximately 7,735 listings during the year. By the end of 2019 the record sales volume in 2019 resulted in only 24 days of supply at year end.

Sales Volume

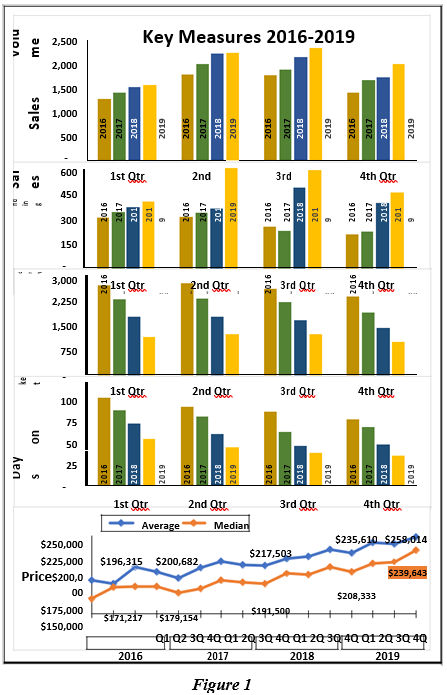
Sales volumes increased in the first three quarters and retreated slightly in the fourth quarter on a record low inventory of listed homes. Sales volume in all quarters were higher compared to the same quarter in 2018. See Figure 1.

Pending Sales

The number of pending sales were higher at the end of each quarter this year. Quarter 2 pending sales experienced a dramatic increase which was sustained through the 3rd quarter before falling slightly in the 4th quarter.

Inventory of Homes Listed

The number of listed homes for sale was at a record low level to begin 2019 and fell in all four quarters. total of 993, the lowest level of the entire decade.

Days on Market

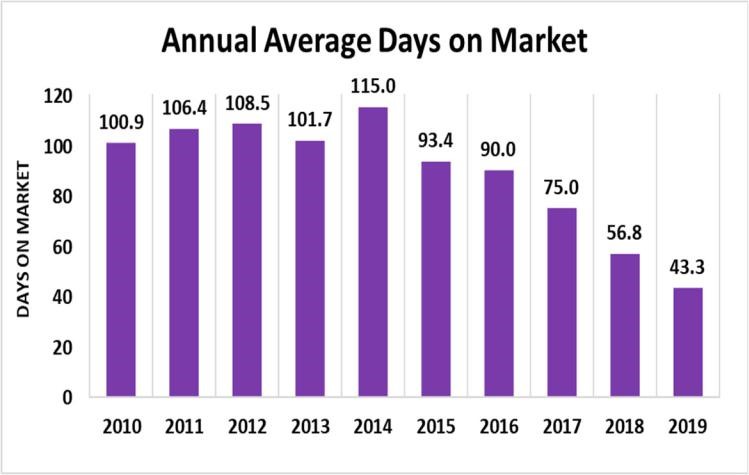
With the record levels of high sales, pending sales, and low inventory, the average days on market predictably fell throughout the year to a new average low of 43 days by year end. Compared with the 2010 average, days on market dropped by more than half (58 days).

Price

The average sales price (blue line) and median sales price (gold line) continued to trend upward to new highs. The median sales price increased 8.8% to $222,702 by the 4th quarter of 2019. The average sales price grew to $247,783, an annual increase of 8.1%. See Price chart in Figure 1.

Overall, demand for homes outpaced the increase in supply of homes listed for sale while median and average sales prices continued to rise.

Units Sold

The total number of units sold in 2019 (8,150) increased 7.9% from 2018 and 86% from 2010. The annual number of units has risen each year since 2011, the lowest level during the decade. See Figure 2.

Sales Price Levels

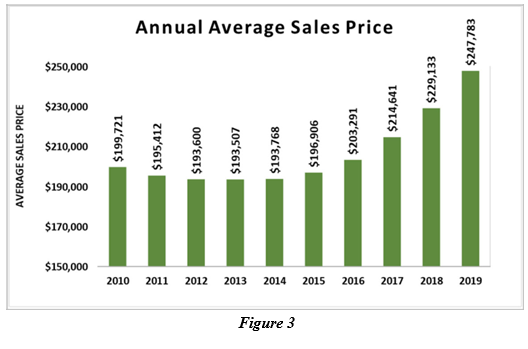
Sale price levels continued to rise in 2019. The annual average sales price reached $247,783 in 2019, up 8.1% from 2018. Since 2010, average sales price has increased $48,062 from $199,721 and $54,276 from the lowest level of the decade in 2013. Figure 3.

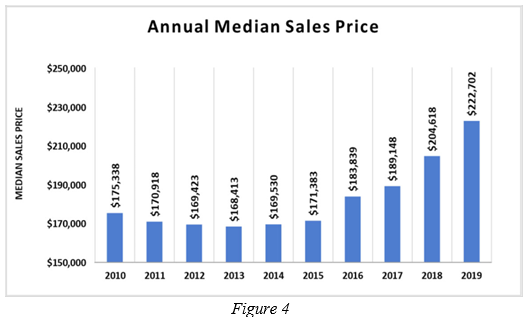
The median sales price represents the price at which about 4,000 homes were sold at a lower price in 2019 and 4,000 homes were sold at a higher price. Annual median levels rose throughout the decade, up 27% since 2010 and 28% since the low of 2013. The median price was 8.8% higher than the 2018 level. Figure 4.

Average Days on Market

Number of days on market is a measure of how fast the market is moving. In 2019, the average days on market dropped to 43 days average for the year with the lowest monthly level of 31 days in October. This is a major reduction from the 101 DOM in 2010. Considering the record low inventory at December 31 (993 listed homes), the level of days on market may continue around the current level for several months. See Figure 5.

Sales and Inventory

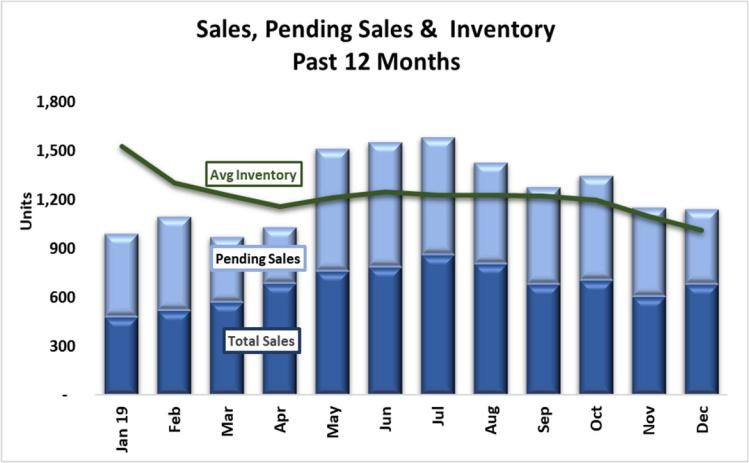
Home sales for the year reached 8,150 and peaked in July, a record annual level. The total of sales and pending sales by month exceeded the total number of listed homes available for sale in eight of twelve months beginning in May. See Figure 6. Total home sales were 1,995 for the 4th quarter.

The  December  ending  inventory (993) was the lowest level in at least two decades. The number of pending sales at 456 was down from the twenty-year peak of 763 in June 2019.

Summary

Overall, the local economy experienced significant growth and residential real estate enjoyed tremendous success. Demand increased faster than the supply of homes producing upward pressure on prices, shorter sales periods, and stimulation of new construction. With the announced local job growth and the related increase in population, the real estate momentum is likely to continue well into the new year. Barring a significant economic event or slow growth in new home construction, this momentum should positively impact the market at least in the near term.

Data Sources:
Alabama Department of Labor
Chamber of Commerce of Huntsville/Madison County
Huntsville Area Association of Realtors Quarterly Reports U.S. Bureau of Economic Analysis
U.S. Census Bureau Valley MLS System
Analysis & Report Prepared By:
  • Jeff Thompson, Project Director
  • Brinda Mahalingam, Ph.D., Economist
Questions regarding this report should be directed to:
Jeff Thompson, jeff.thompson@uah.edu, 256.361.9065
Read More