


If you would like your company’s branding placed on this report to distribute to your clients or colleagues, please email Daniela Perallon your request with a high resolution logo at Daniela@valleymls.com.
2019 Annual Report
This year, October was the peak month for the lowest average time houses stayed on market, at 31 days. Although that time has increased slightly toward the end of the year, 2020 is expected to hover around the annual average in the first quarter of next year. 2020 will also see lower inventory than the 993 listings seen on December 31.
Although housing prices are rising at manageable rates with an improving economy, costs could increase at a higher rate in 2020 because of further dwindling inventory and higher-income families expected to move into the region in the year to come.
Residential real estate in Madison County reached new heights of success in 2019 with total sales of $2.0 billion up from the previous high in 2018 of $1.75 billion. There were 8,150 properties sold in an average of only 43 days-on-market (DOM) compared to 57 last year. Median sales price continued to climb to $222,702 an increase of 8.8% over 2018 and up 30% since 2015. There were approximately 7,735 listings during the year. By the end of 2019 the record sales volume in 2019 resulted in only 24 days of supply at year end.
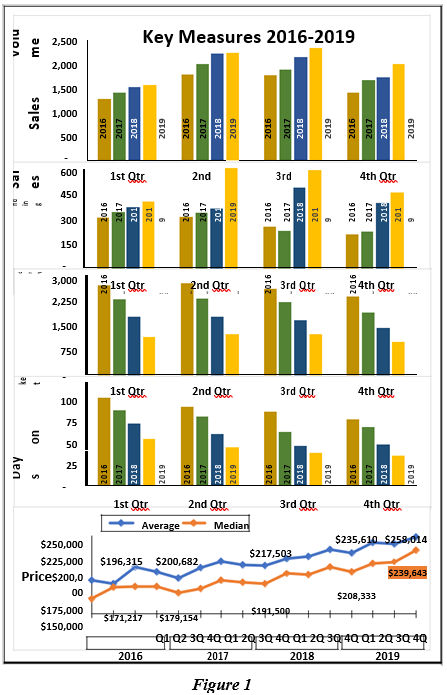
Sales Volume
Sales volumes increased in the first three quarters and retreated slightly in the fourth quarter on a record low inventory of listed homes. Sales volume in all quarters were higher compared to the same quarter in 2018. See Figure 1.
Pending Sales
The number of pending sales were higher at the end of each quarter this year. Quarter 2 pending sales experienced a dramatic increase which was sustained through the 3rd quarter before falling slightly in the 4th quarter.
Inventory of Homes Listed
The number of listed homes for sale was at a record low level to begin 2019 and fell in all four quarters. total of 993, the lowest level of the entire decade.
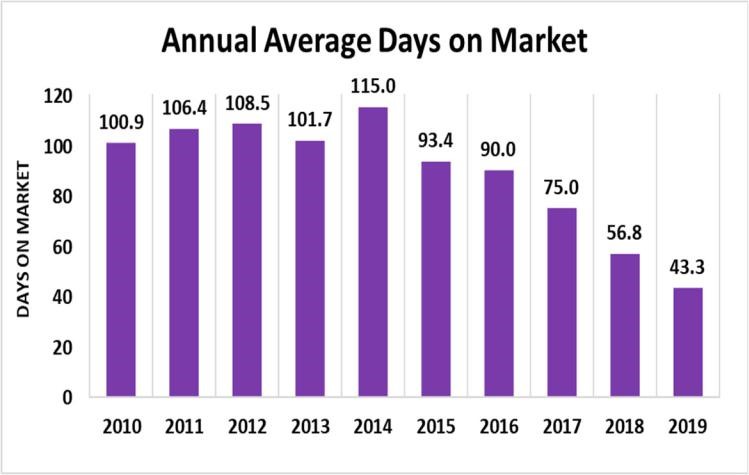
Days on Market
With the record levels of high sales, pending sales, and low inventory, the average days on market predictably fell throughout the year to a new average low of 43 days by year end. Compared with the 2010 average, days on market dropped by more than half (58 days).
Price
The average sales price (blue line) and median sales price (gold line) continued to trend upward to new highs. The median sales price increased 8.8% to $222,702 by the 4th quarter of 2019. The average sales price grew to $247,783, an annual increase of 8.1%. See Price chart in Figure 1.
Overall, demand for homes outpaced the increase in supply of homes listed for sale while median and average sales prices continued to rise.
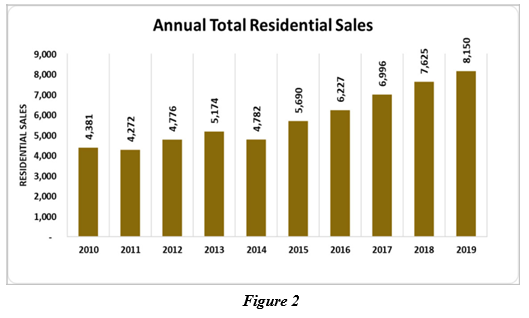
Units Sold
The total number of units sold in 2019 (8,150) increased 7.9% from 2018 and 86% from 2010. The annual number of units has risen each year since 2011, the lowest level during the decade. See Figure 2.
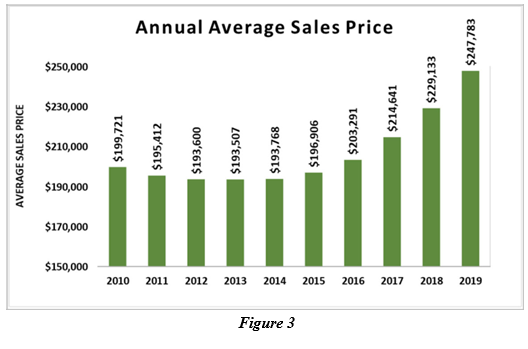
Sales Price Levels
Sale price levels continued to rise in 2019. The annual average sales price reached $247,783 in 2019, up 8.1% from 2018. Since 2010, average sales price has increased $48,062 from $199,721 and $54,276 from the lowest level of the decade in 2013. Figure 3.
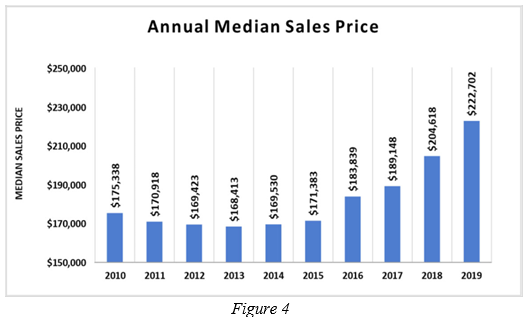
The median sales price represents the price at which about 4,000 homes were sold at a lower price in 2019 and 4,000 homes were sold at a higher price. Annual median levels rose throughout the decade, up 27% since 2010 and 28% since the low of 2013. The median price was 8.8% higher than the 2018 level. Figure 4.
Average Days on Market
Number of days on market is a measure of how fast the market is moving. In 2019, the average days on market dropped to 43 days average for the year with the lowest monthly level of 31 days in October. This is a major reduction from the 101 DOM in 2010. Considering the record low inventory at December 31 (993 listed homes), the level of days on market may continue around the current level for several months. See Figure 5.
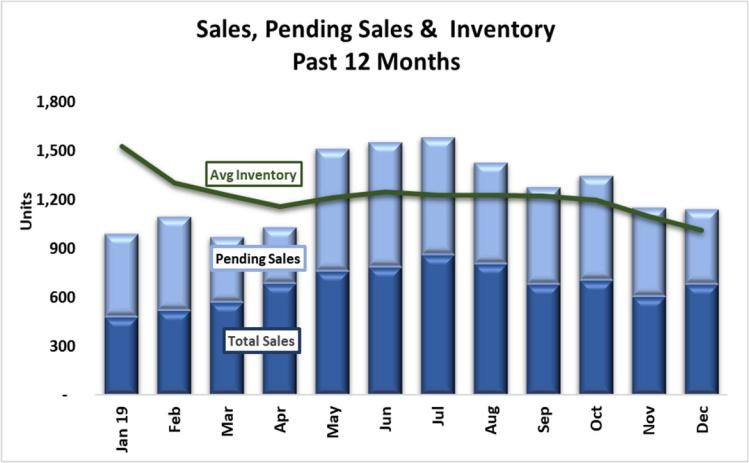
Sales and Inventory
Home sales for the year reached 8,150 and peaked in July, a record annual level. The total of sales and pending sales by month exceeded the total number of listed homes available for sale in eight of twelve months beginning in May. See Figure 6. Total home sales were 1,995 for the 4th quarter.
The December ending inventory (993) was the lowest level in at least two decades. The number of pending sales at 456 was down from the twenty-year peak of 763 in June 2019.
Summary
Overall, the local economy experienced significant growth and residential real estate enjoyed tremendous success. Demand increased faster than the supply of homes producing upward pressure on prices, shorter sales periods, and stimulation of new construction. With the announced local job growth and the related increase in population, the real estate momentum is likely to continue well into the new year. Barring a significant economic event or slow growth in new home construction, this momentum should positively impact the market at least in the near term.
Data Sources:
Alabama Department of Labor
Chamber of Commerce of Huntsville/Madison County
Huntsville Area Association of Realtors Quarterly Reports U.S. Bureau of Economic Analysis
U.S. Census Bureau Valley MLS System
Analysis & Report Prepared By:
Jeff Thompson, Project Director
Brinda Mahalingam, Ph.D., Economist