June 2026 Fast Stats: North Alabama real estate market update
Posted on 08/15/2026
The July 2026 North Alabama real estate market update is in. Staying ahead of regional inventory shifts, sales volume, and pricing trends is essential for positioning your listings, setting seller expectations, and advising home buyers.
Across the Combined Market, home sales surged year-over-year while median prices nudged higher, signalling strong ongoing buyer demand throughout the region. Below is your comprehensive, area-by-area breakdown of the latest ValleyMLS statistics.
📊 North Alabama Real Estate Market Update Combined Overview
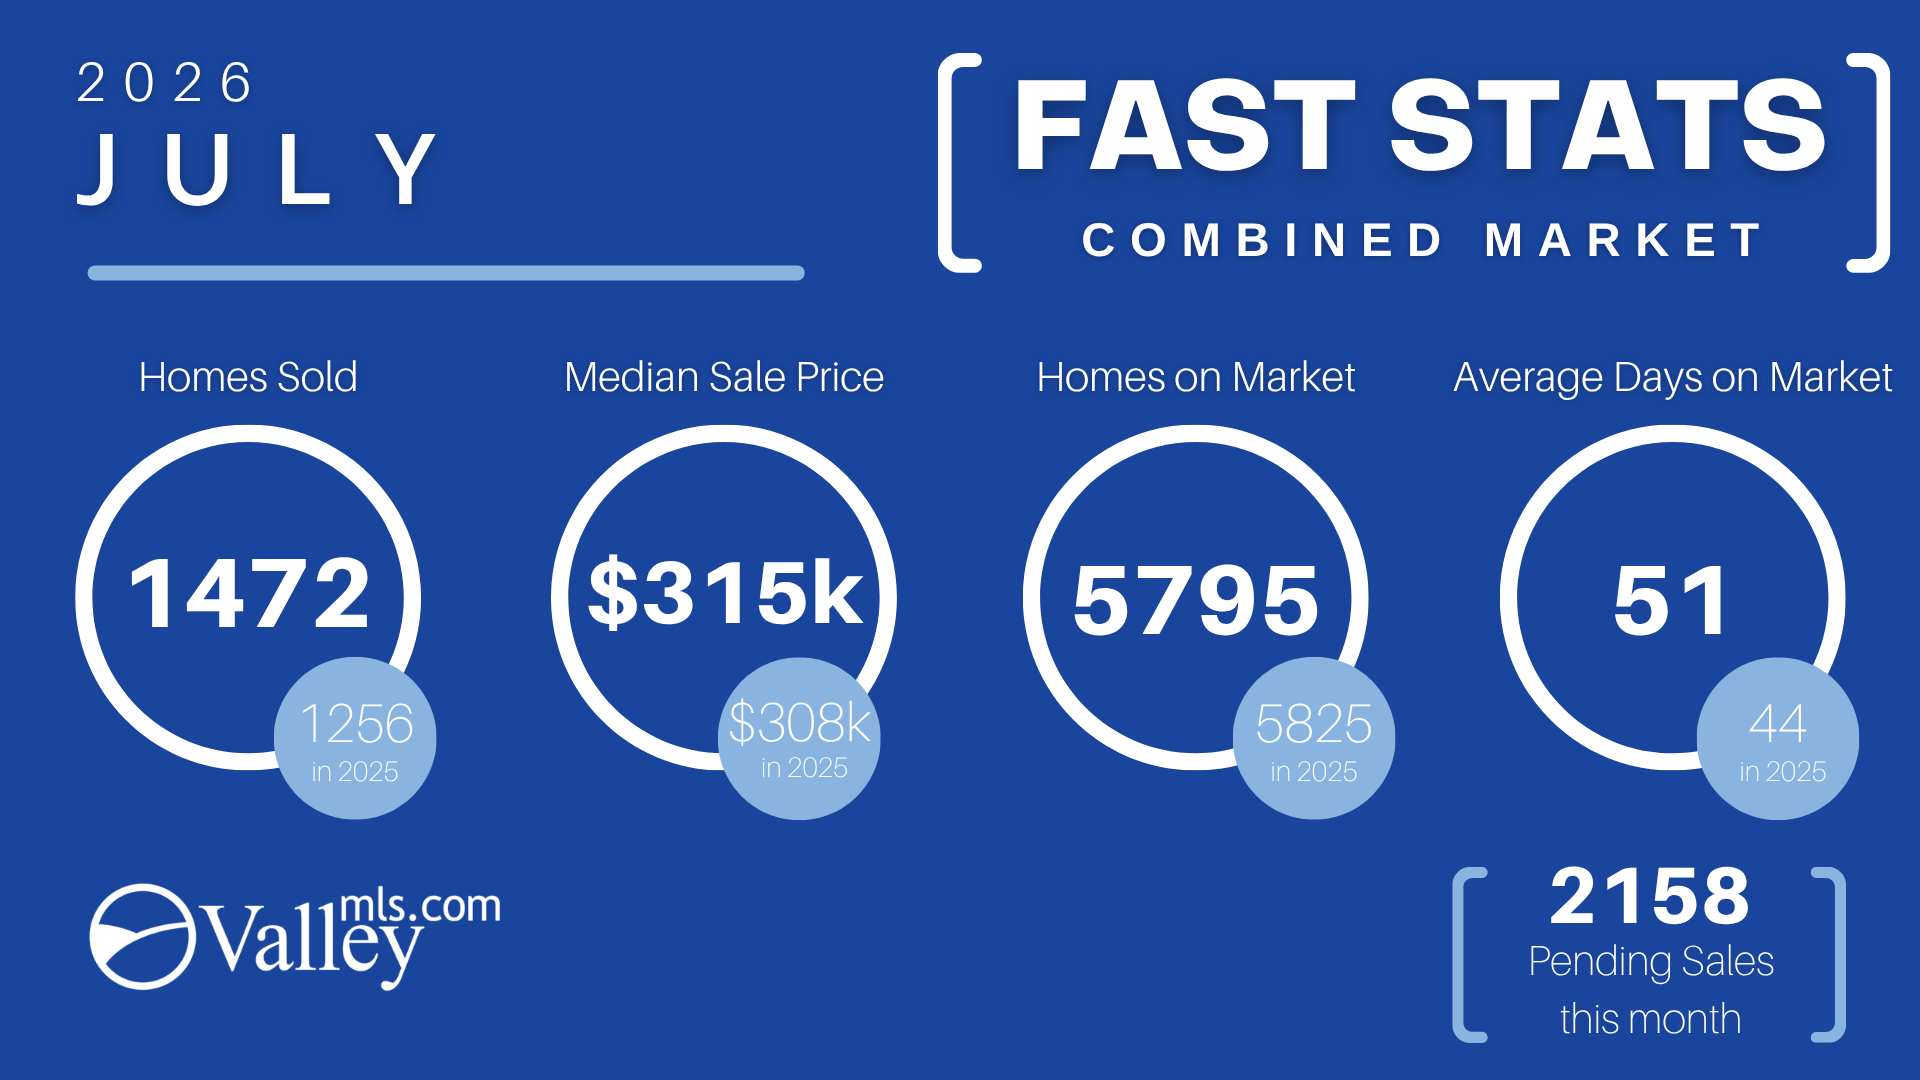
Across all primary submarkets, sales activity posted a significant year-over-year increase, supported by robust pending sales pipelines entering late summer.
Homes Sold:1,472(Up from 1,256 in July 2025)
Median Sale Price:$315,000(Up from $308,000 in July 2025)
Homes on Market (Inventory):5,795(Slightly down from 5,825 in July 2025)
Average Days on Market (DOM):51 days(Up from 44 days in July 2025)
Pending Sales:2,158 active under-contract properties
REALTOR® Takeaway: The broader market displays strong underlying momentum. Higher sales volume paired with consistent median price growth demonstrates healthy market demand despite properties taking slightly longer to close.
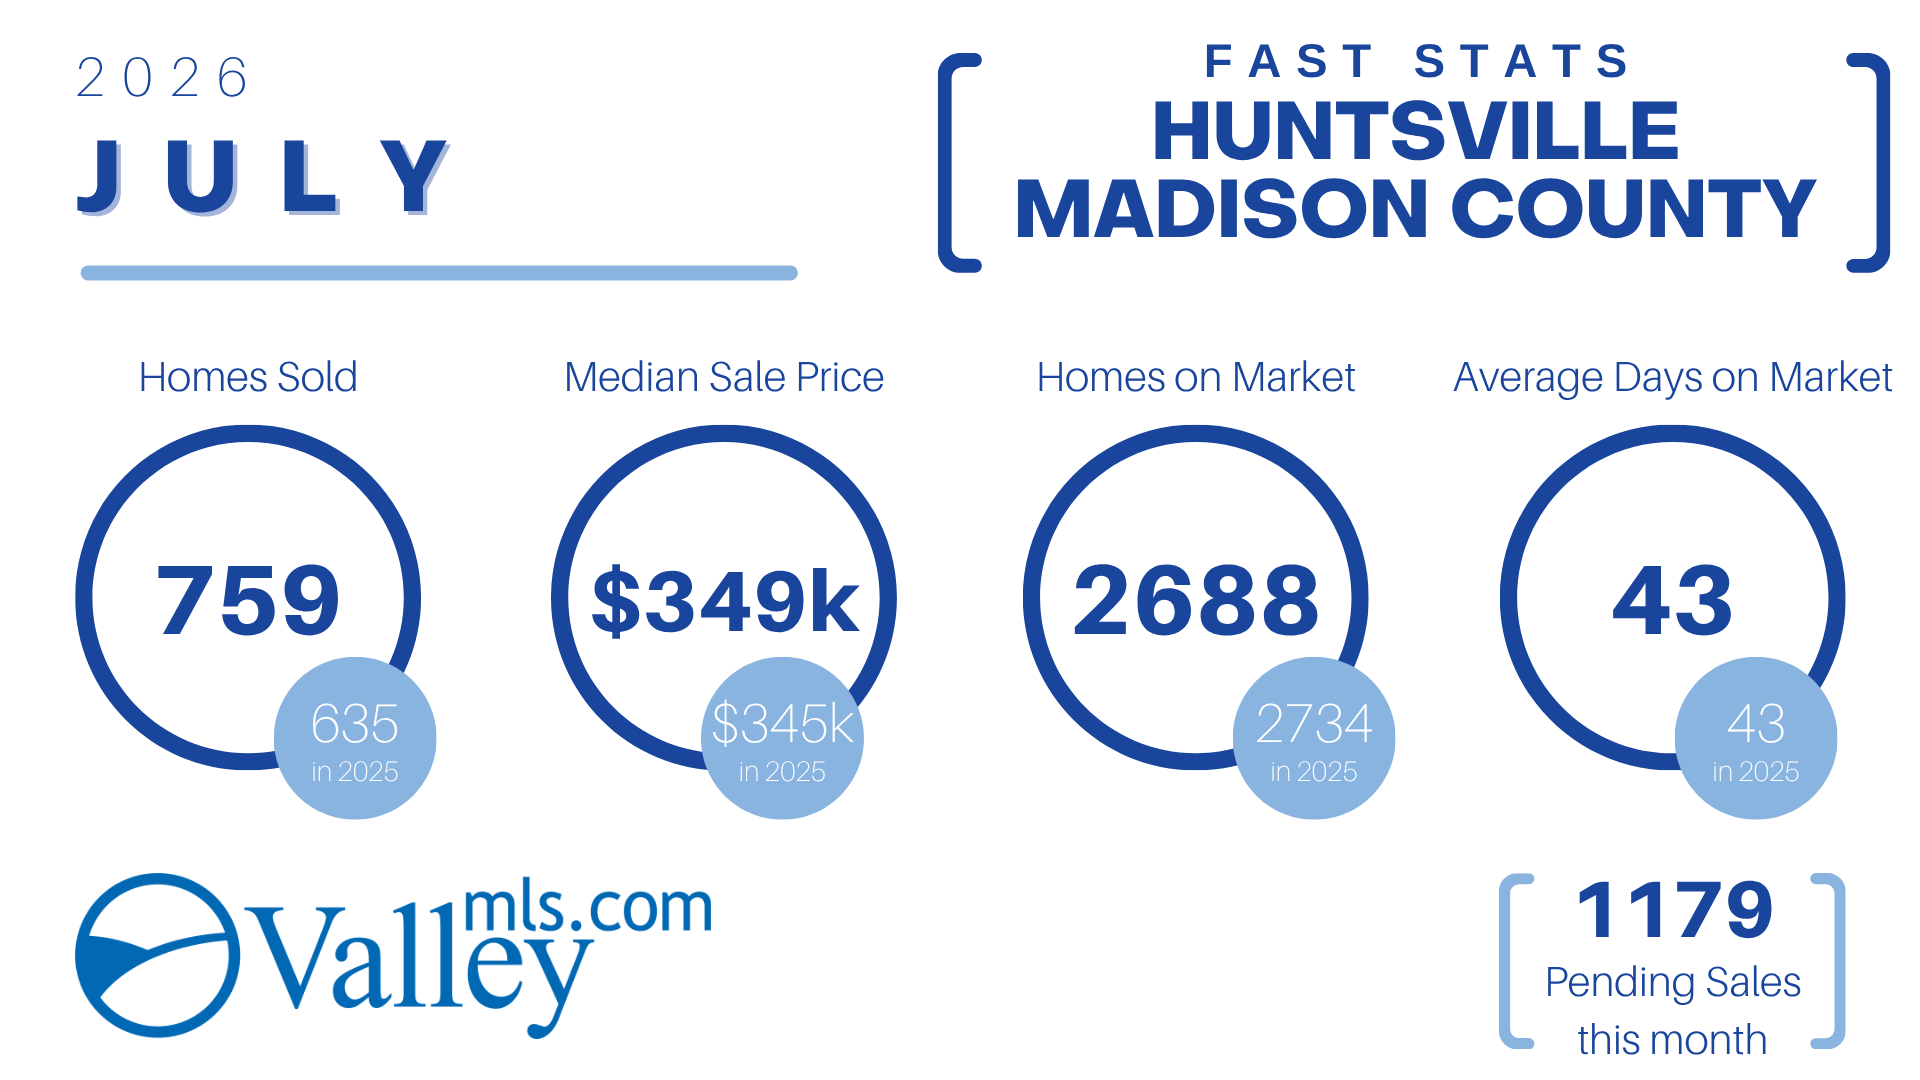
The region’s core engine saw strong demand, driven by a sharp rise in total closed units year-over-year while DOM remained exceptionally tight.
Metric
Homes Sold
Median Sale Price
Homes on Market
Average DOM
Pending Sales
July 2026
759
$349k
2,688
43 days
1,179
July 2025
635
$345k
2,734
43 days
740
Trend
🟢 +19.5%
🟢 +1.1%
🔴 -1.7%
⚪ Flat
High Pipeline
Athens & Limestone County
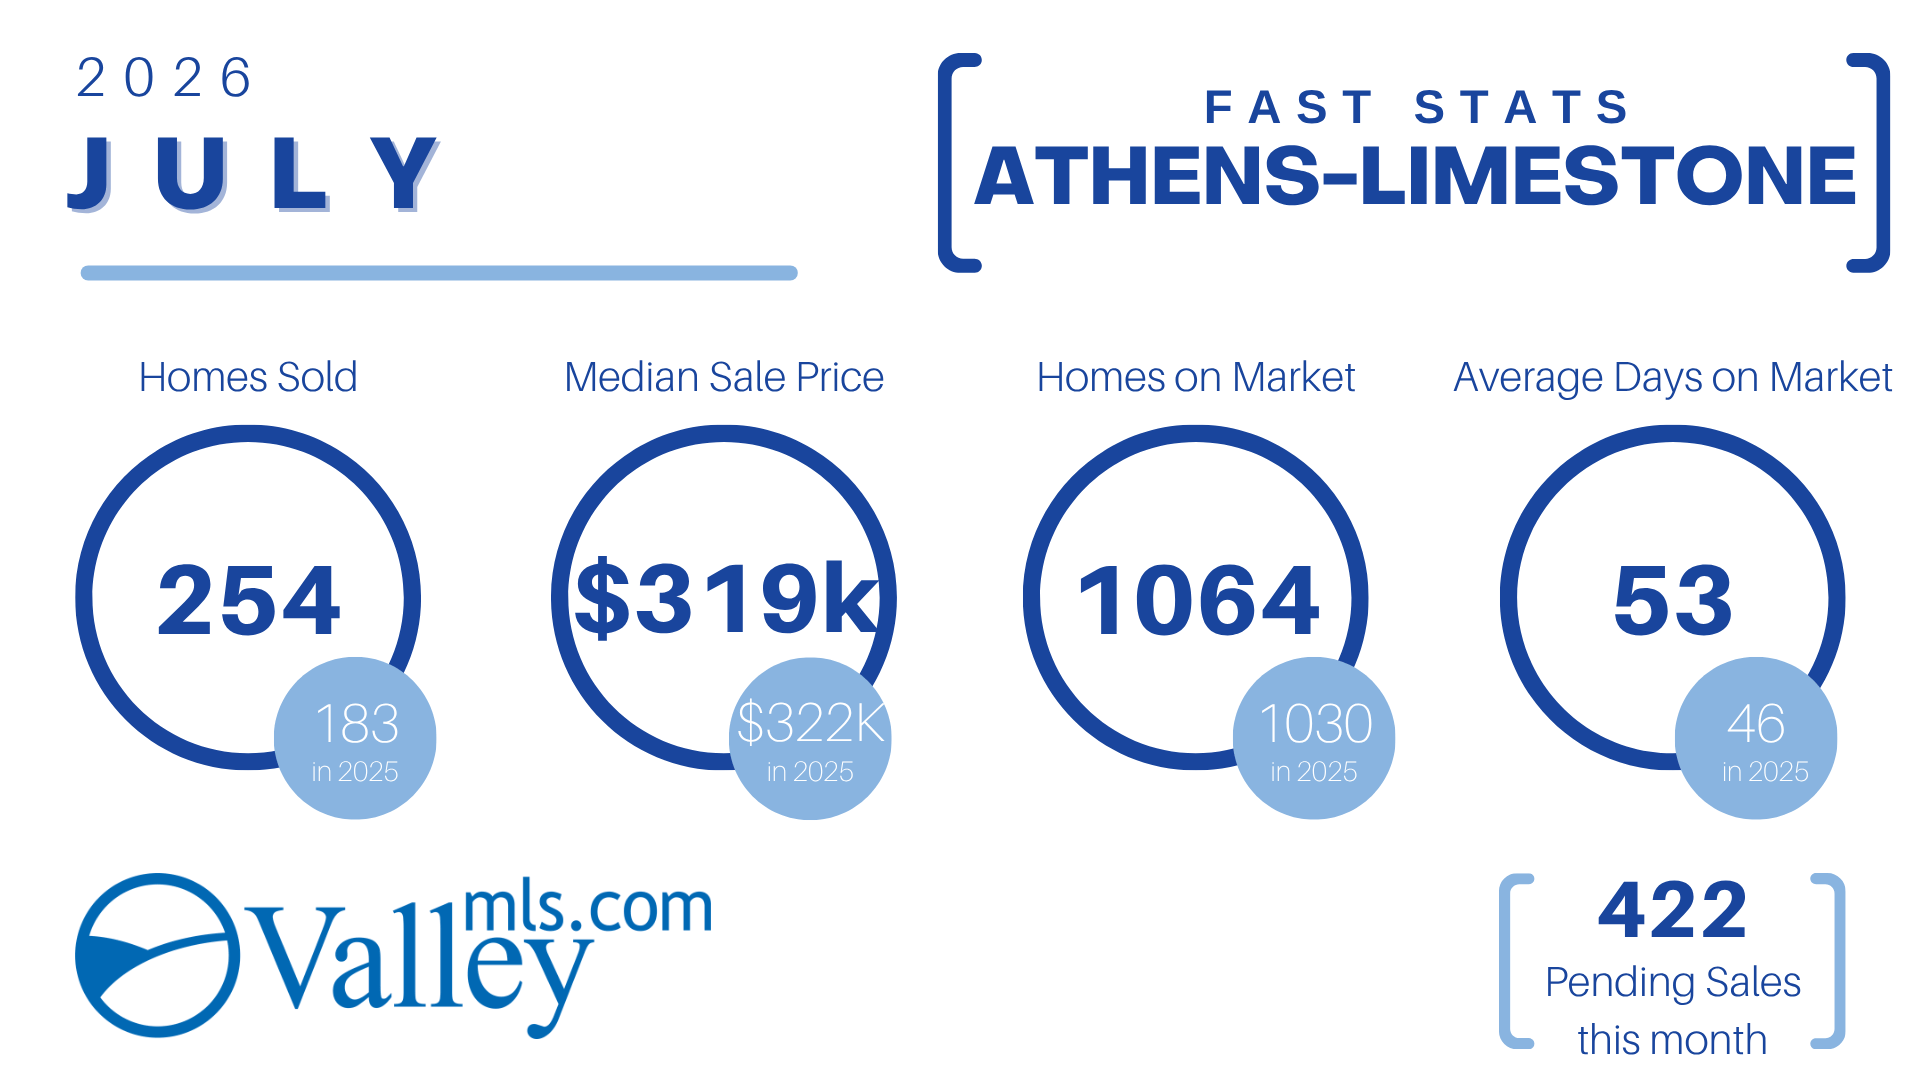
Limestone County experienced a major leap in completed transactions, alongside a modest correction in median price.
Homes Sold:254(vs. 183 in 2025)
Median Sale Price:$319,000(vs. $322,000 in 2025)
Active Listings:1,064(vs. 1,030 in 2025)
Avg. Days on Market:53 days(vs. 46 days in 2025)
Pending Sales:422
DeKalb County
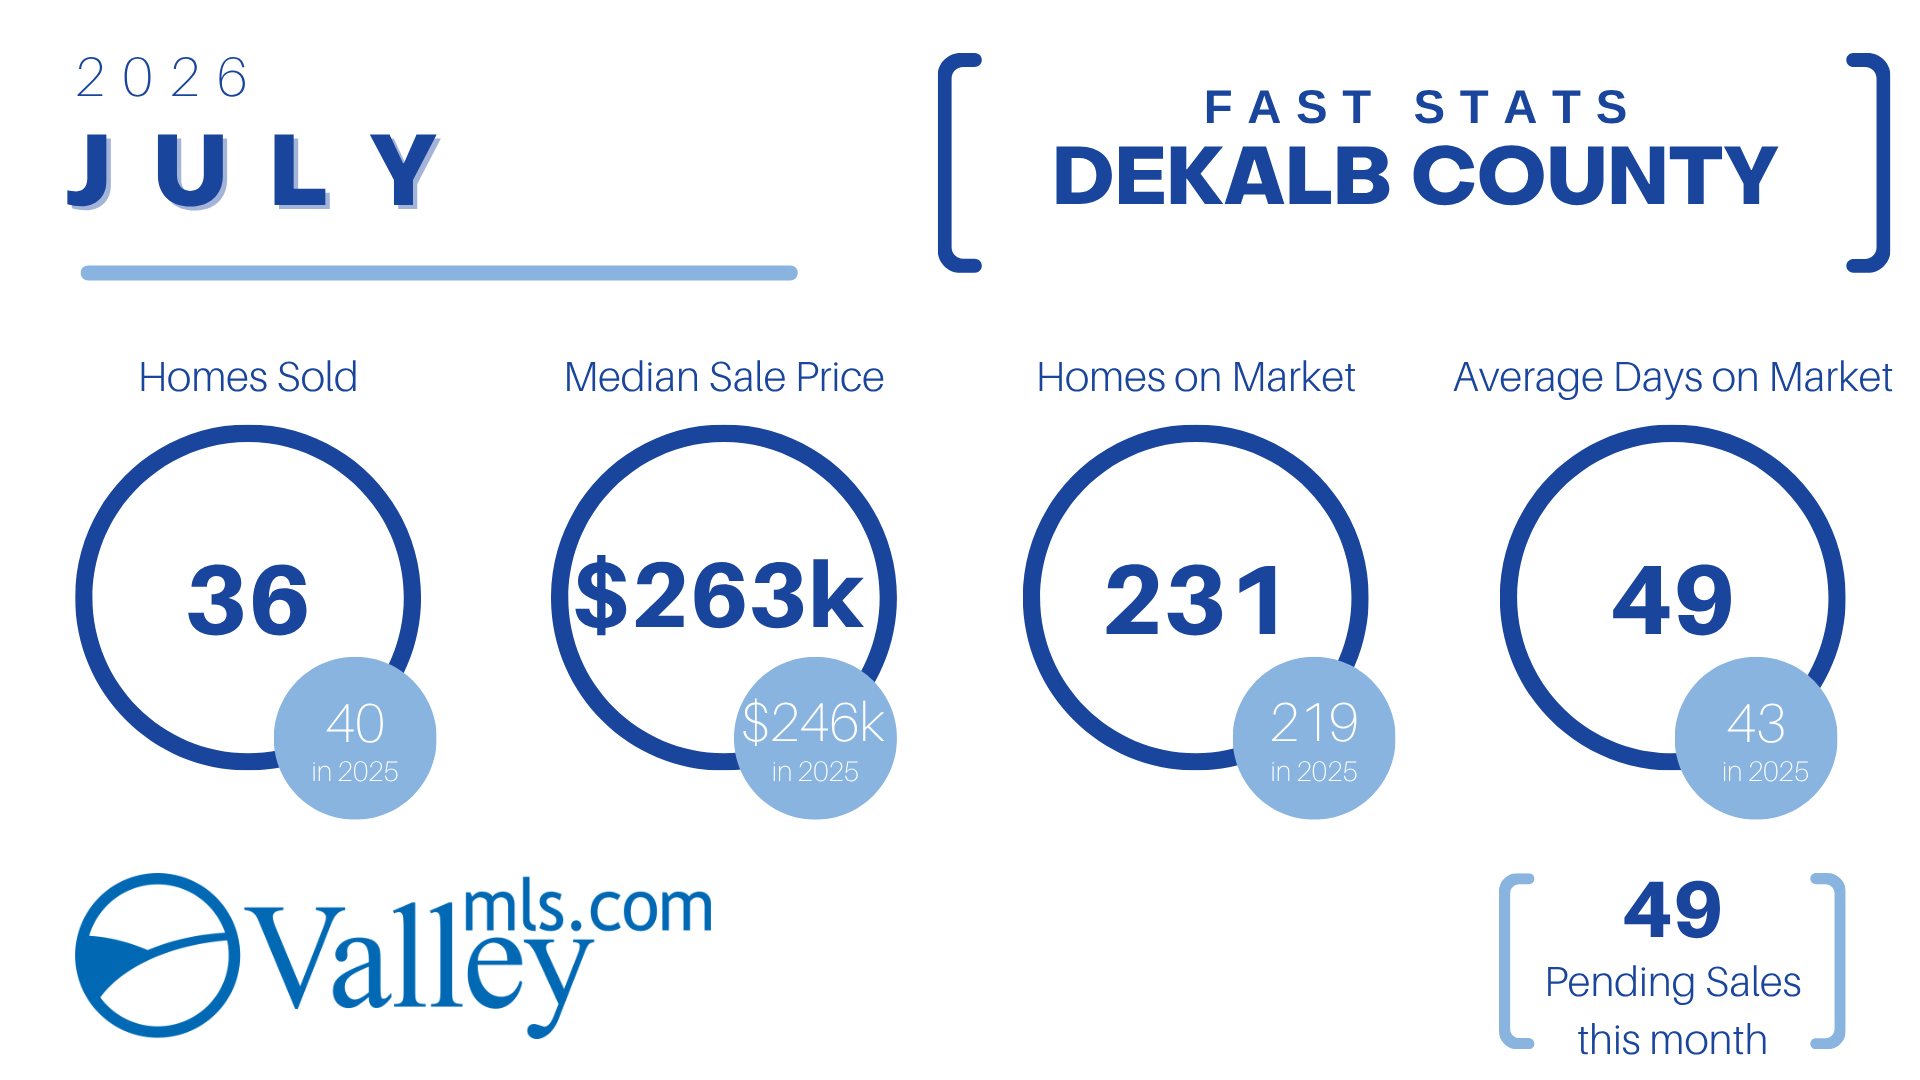
DeKalb experienced steady median price appreciation while total inventory saw a slight expansion.
Homes Sold:36(vs. 40 in 2025)
Median Sale Price:$263,000(vs. $246,000 in 2025)
Active Listings:231(vs. 219 in 2025)
Avg. Days on Market:49 days(vs. 43 days in 2025)
Pending Sales:49
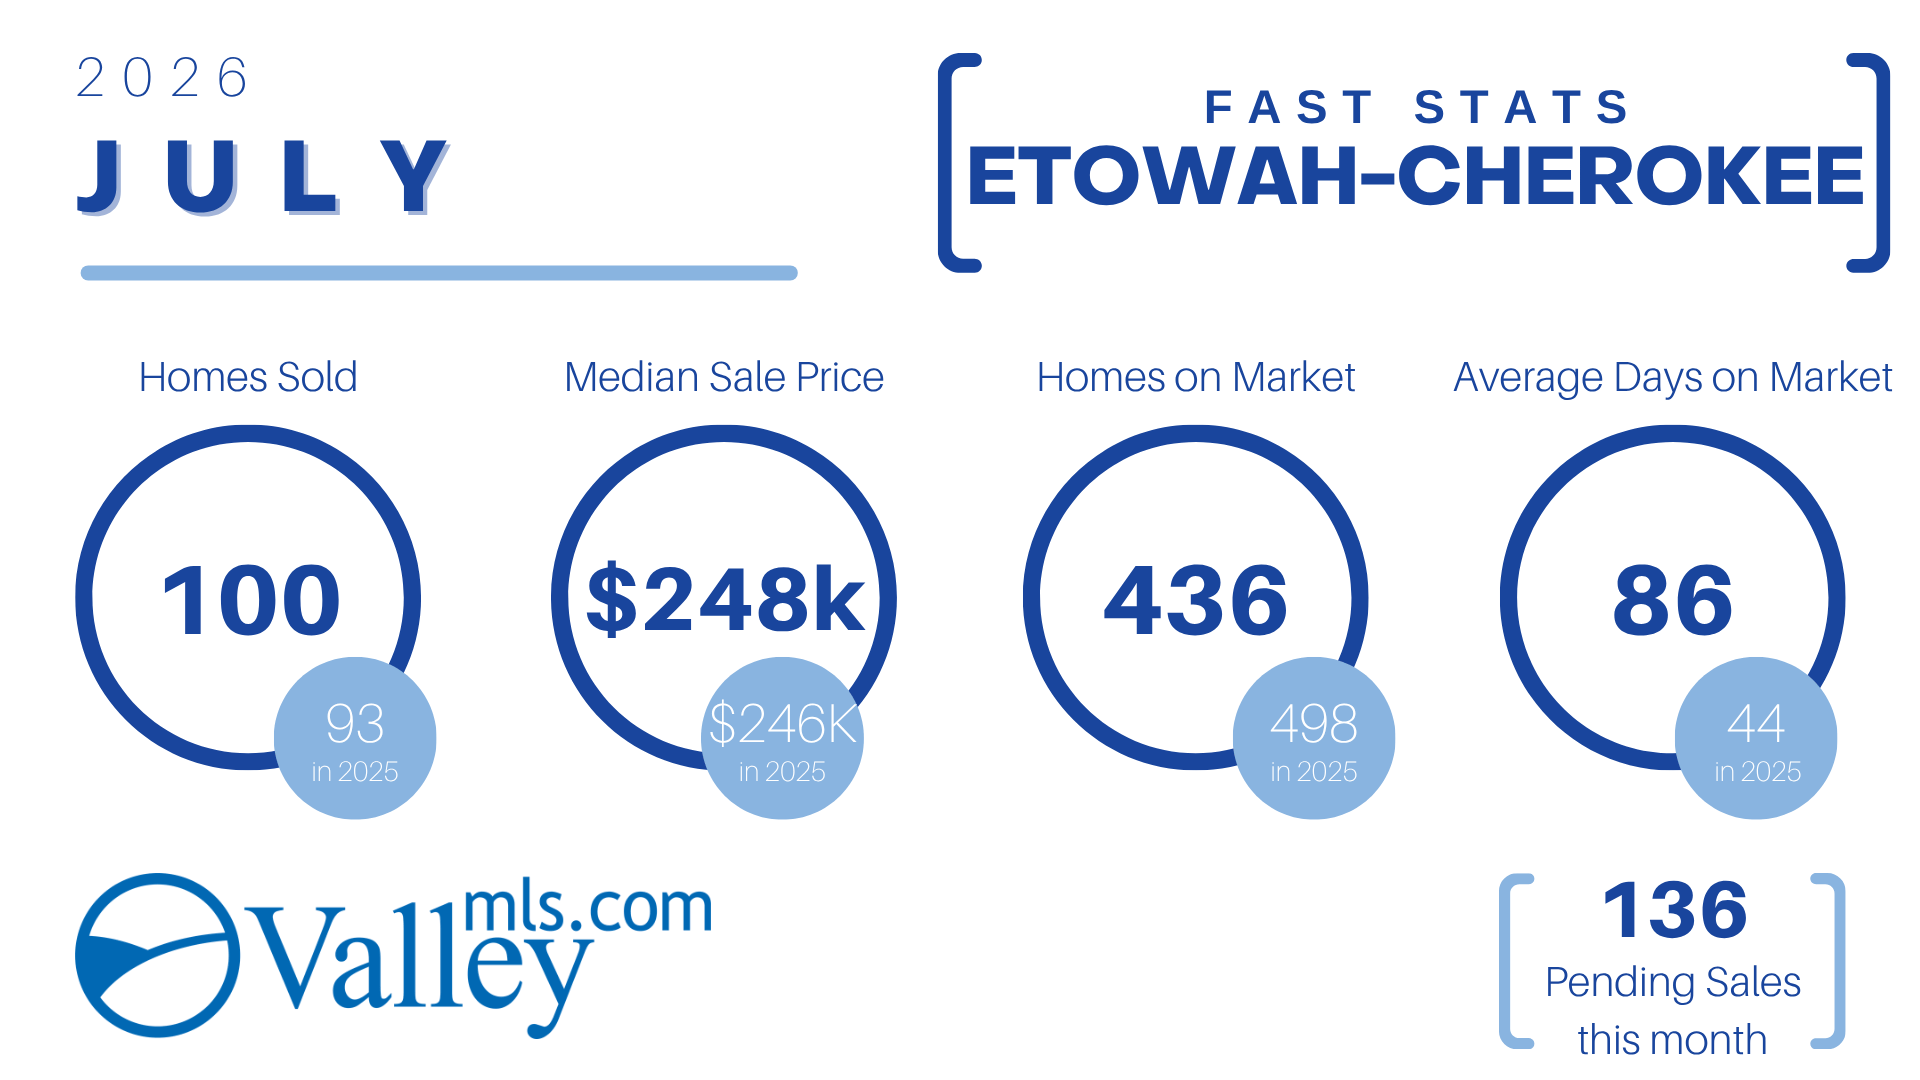
Etowah & Cherokee Counties
While days on market extended, overall sales increased and pricing remained firm.
Homes Sold:100(vs. 93 in 2025)
Median Sale Price:$248,000(vs. $246,000 in 2025)
Active Listings:436(vs. 498 in 2025)
Avg. Days on Market:86 days(vs. 44 days in 2025)
Pending Sales:136
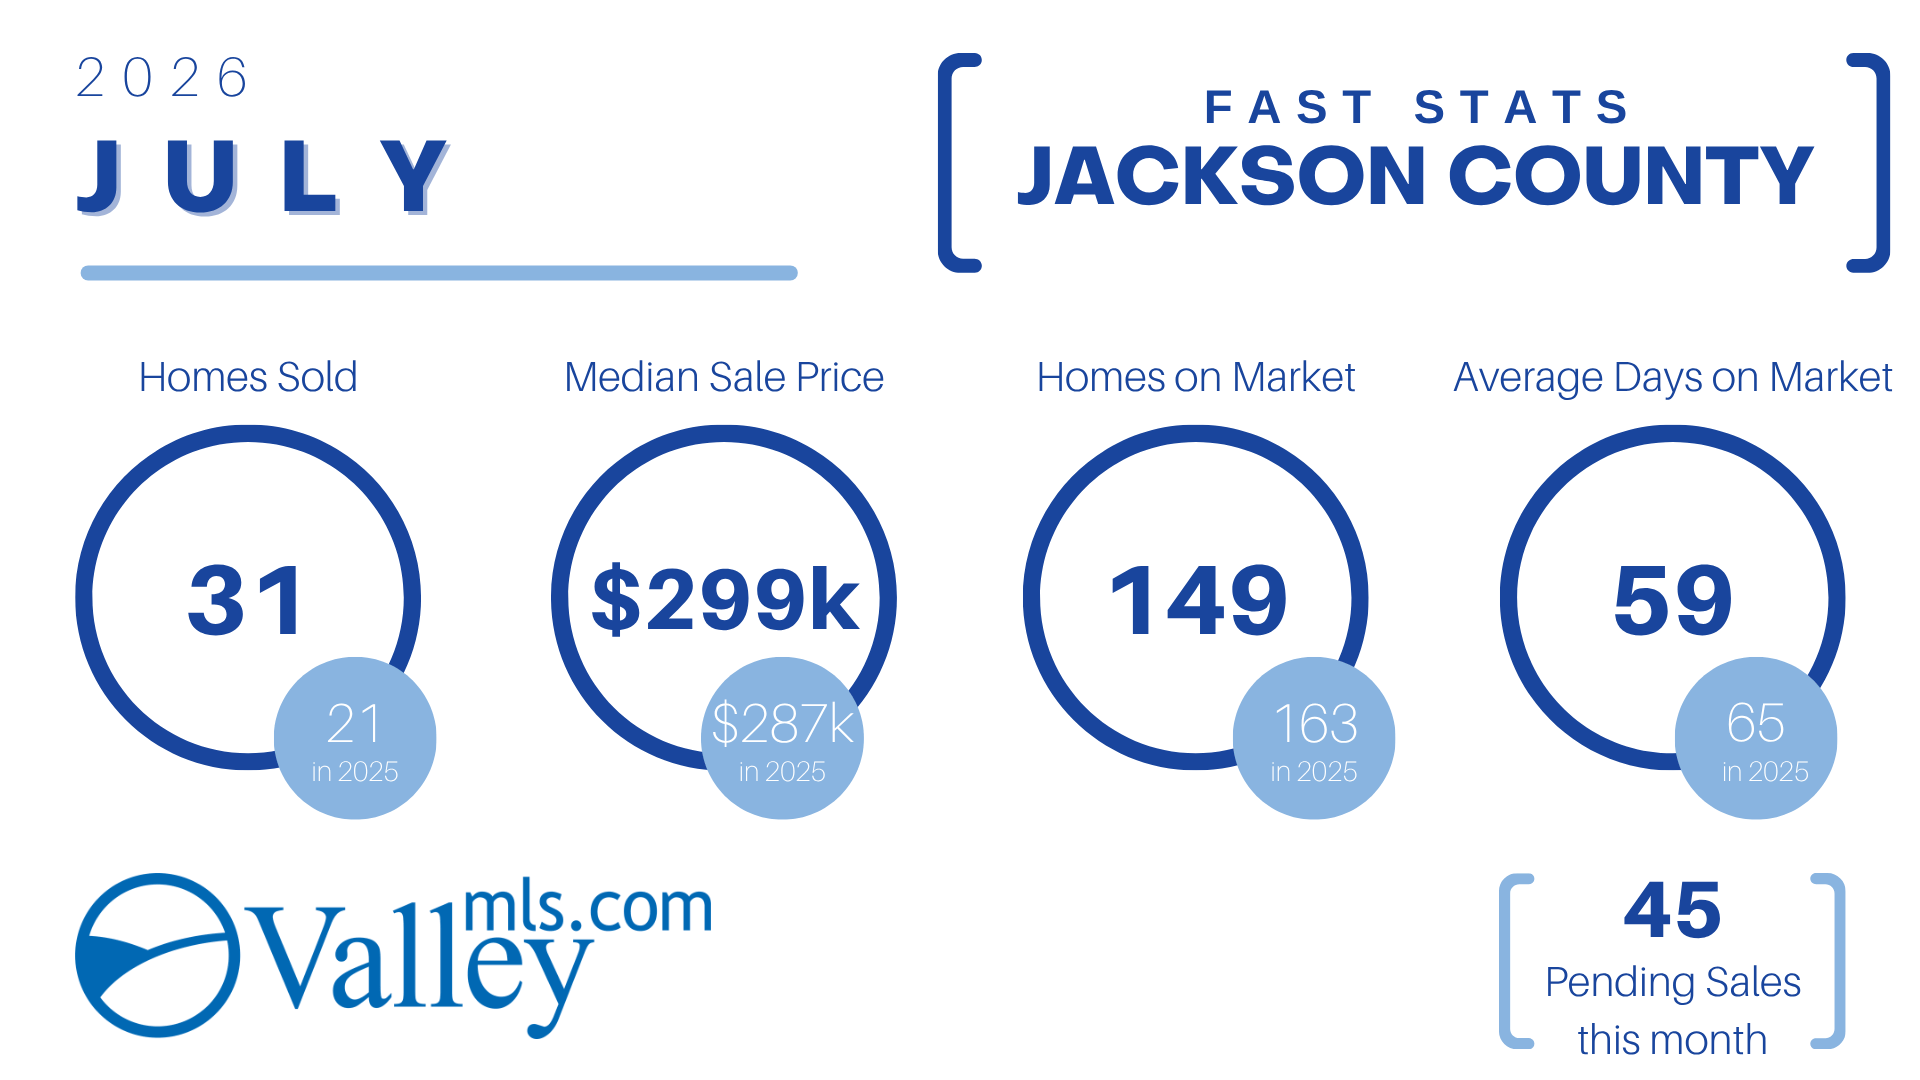
Jackson County
Jackson County saw sales jump by nearly 48% year-over-year, making it one of the top growth markets in unit volume.
Homes Sold:31(vs. 21 in 2025)
Median Sale Price:$299,000(vs. $287,000 in 2025)
Active Listings:149(vs. 163 in 2025)
Avg. Days on Market:59 days(Down from 65 days in 2025)
Pending Sales:45
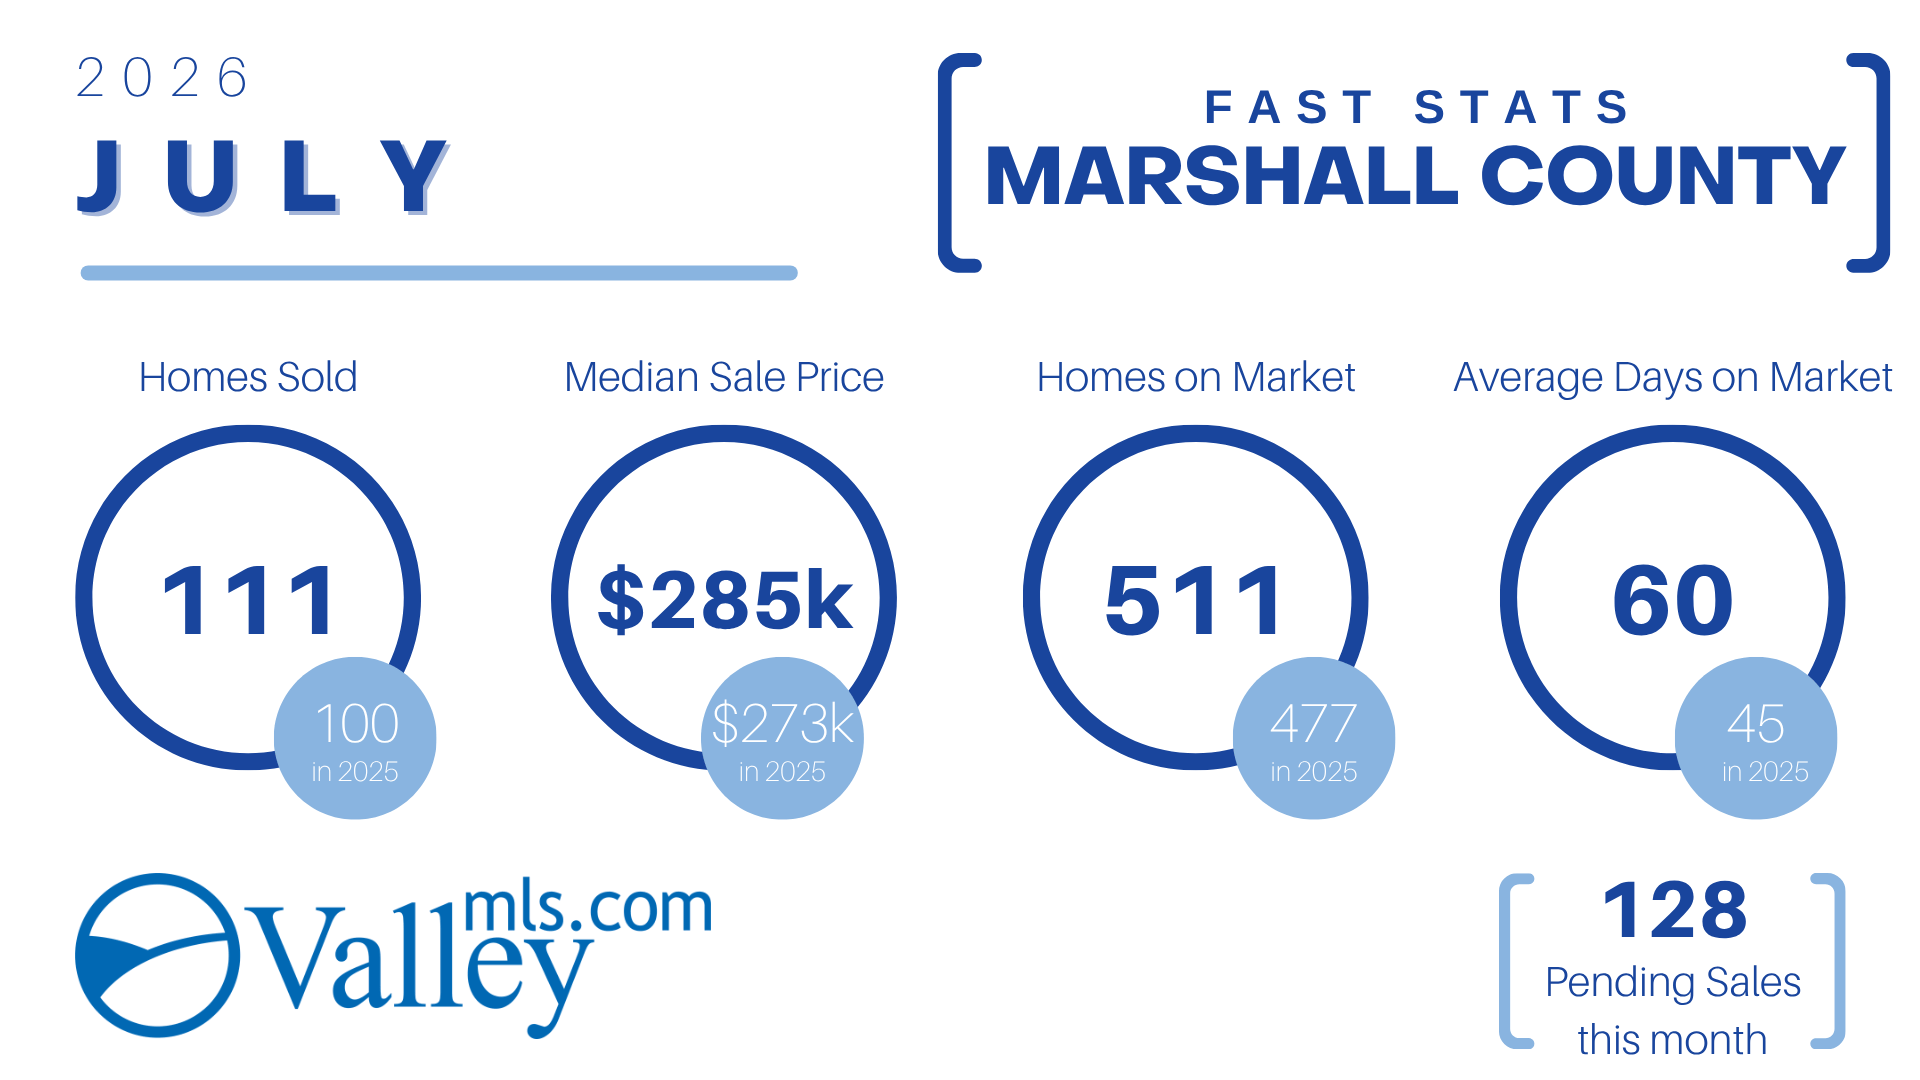
Marshall County
Marshall County demonstrated gains in price appreciation, with home prices rising by over $12,000 year-over-year.
Homes Sold:111(vs. 100 in 2025)
Median Sale Price:$285,000(vs. $273,000 in 2025)
Active Listings:511(vs. 477 in 2025)
Avg. Days on Market:60 days(vs. 45 days in 2025)
Pending Sales:128
Morgan & Lawrence Counties
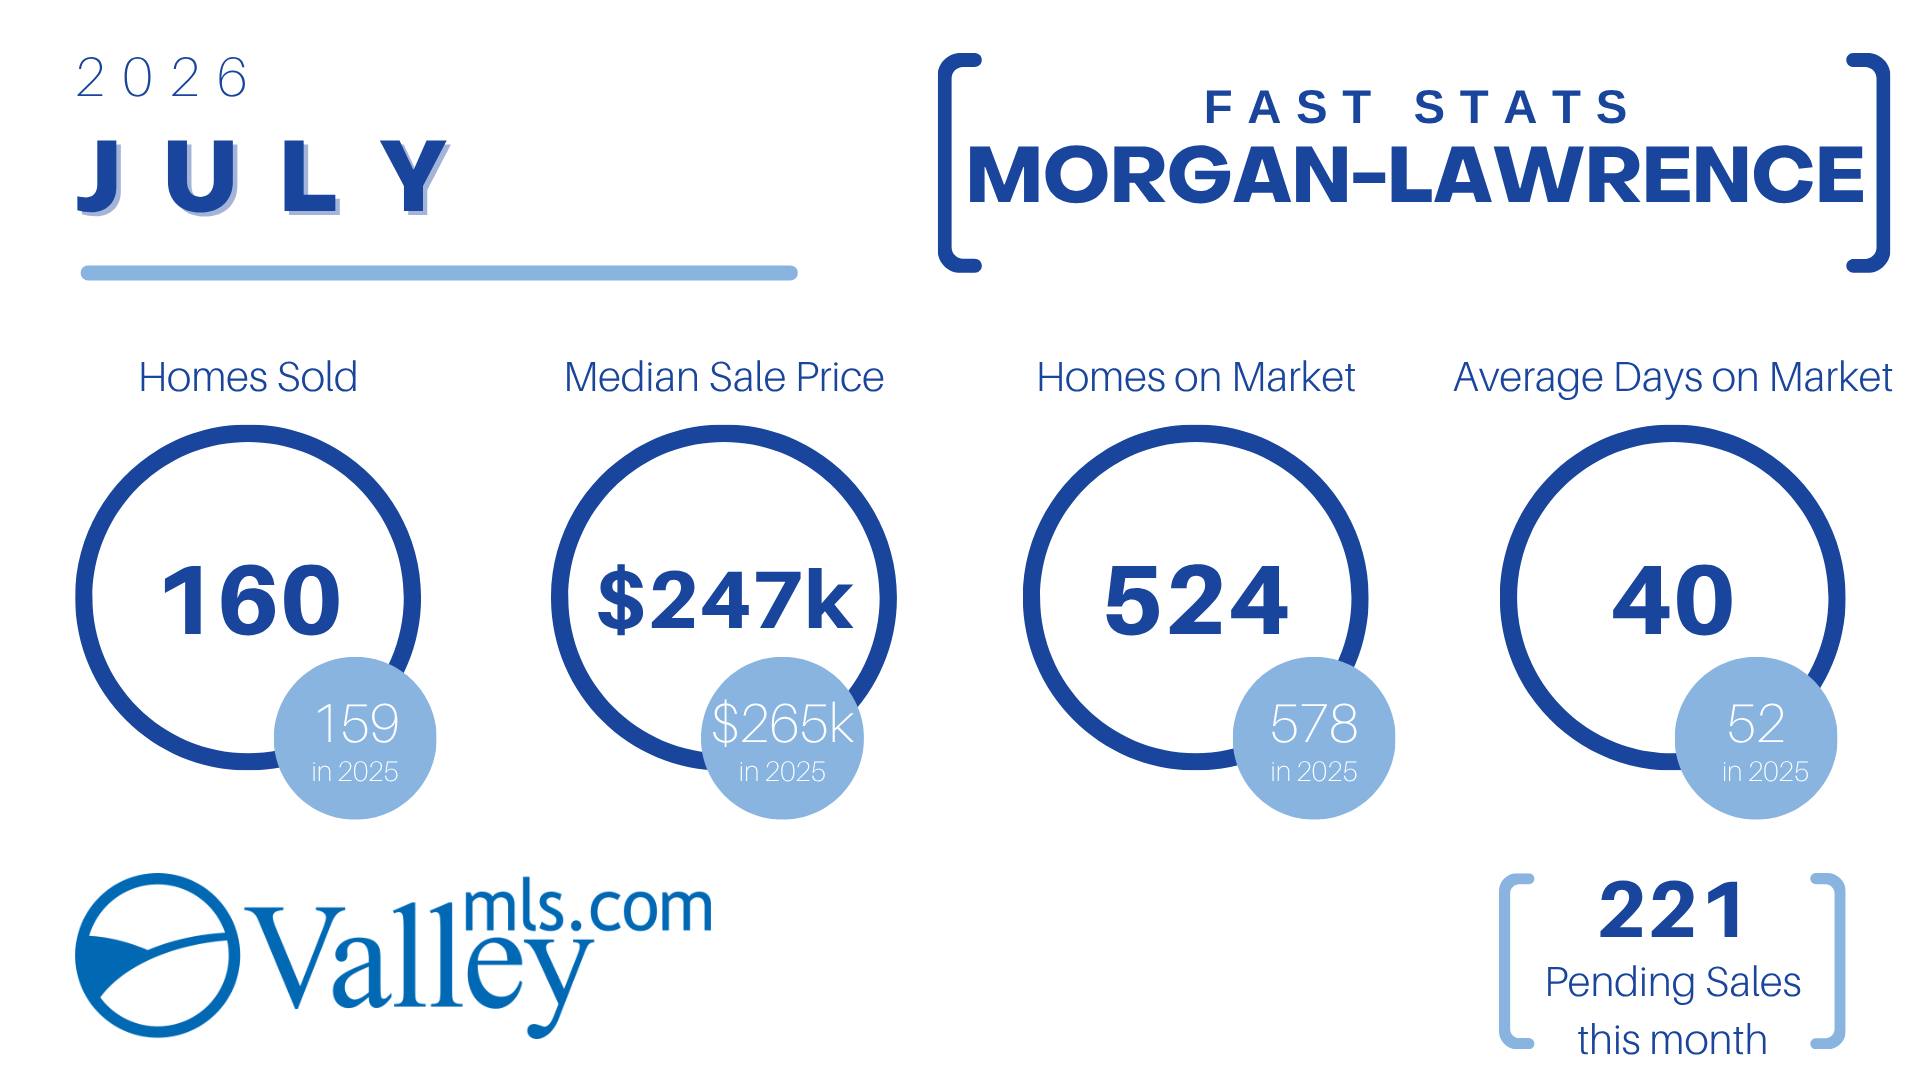
Morgan-Lawrence saw a significant contraction in DOM alongside steady unit sales.
Homes Sold:160(vs. 159 in 2025)
Median Sale Price:$247,000(vs. $265,000 in 2025)
Active Listings:524(vs. 578 in 2025)
Avg. Days on Market:40 days(Down from 52 days in 2025)
Pending Sales:221
💡 How to Leverage These Stats for Your Real Estate Business
Pricing Strategy: Highlight price growth in Madison, Marshall, Jackson, and DeKalb counties when advising sellers on competitive listing strategies.
Buyer Expectations: Use increased Days on Market in regions like Etowah-Cherokee and Marshall to negotiate contingencies or price adjustments for buyers.
Pipeline Management: With 2,158 pending sales across the combined market, fall closing queues remain robust—ensure buyer pre-approvals and closing timelines are dialed in.
Use the North Alabama real estate market update and other resources from HAAR.realtor to inform yourself and your clients!
ValleyMLS.com Market Stats include statistics from the following cities/counties: Athens, Limestone County, Dekalb County, Etowah County, Cherokee County, Huntsville, Madison County, Jackson County, Marshall County, Morgan County, Lawrence County