September 2026 Fast Stats: North Alabama Housing Market Report
Posted on 10/15/2026
The September 2026 housing data from ValleyMLS.com highlights changing dynamics across the North Alabama real estate landscape. From shifting median prices to inventory fluctuations across individual counties, having a clear understanding of these local statistics equips members of the Huntsville Area Association of REALTORS® (HAAR) to guide clients effectively.
Below is a breakdown of the September 2026 market statistics across all regional areas served by ValleyMLS.
Regional Market Summary (Combined Market)
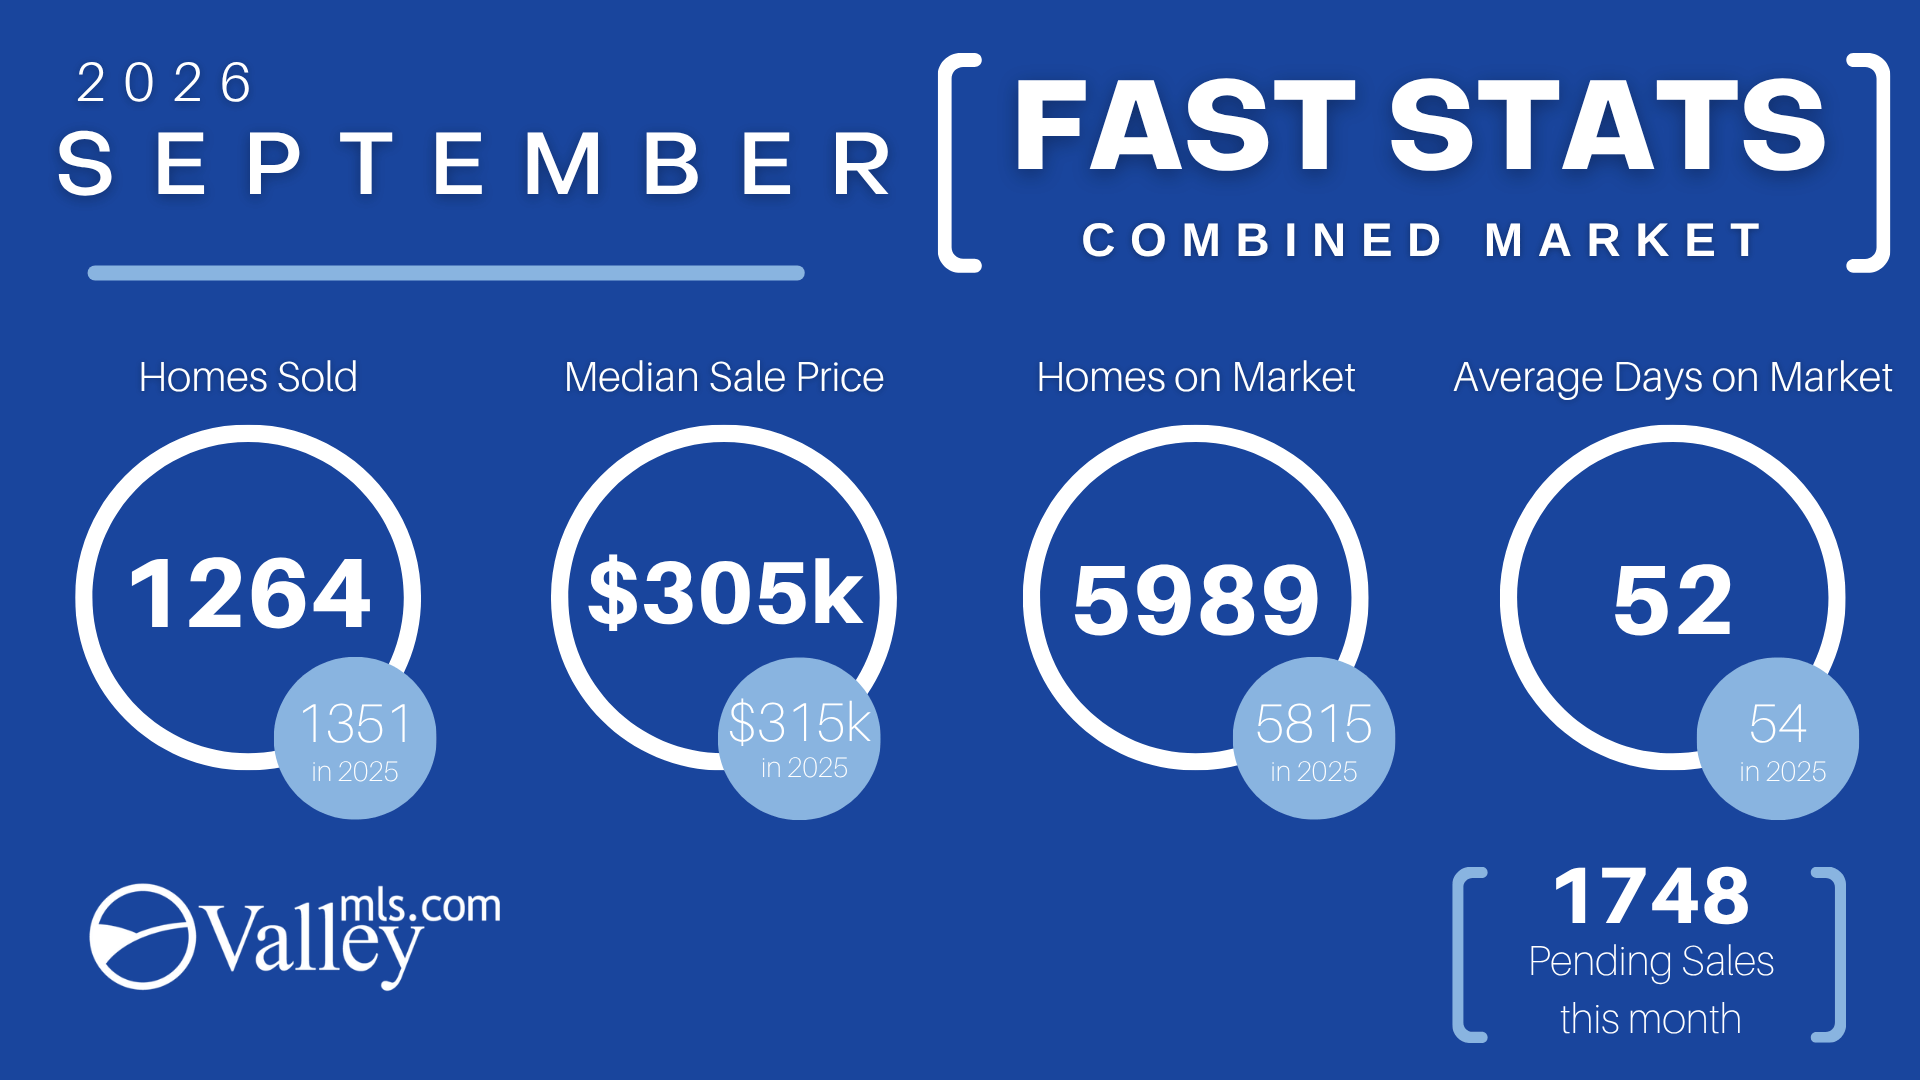
Across the entire combined market area, overall inventory showed steady growth year-over-year while homes sold experienced a moderate adjustment.
Homes Sold: 1,264 (vs. 1,351 in 2025)
Median Sale Price: $305,000 (vs. $315,000 in 2025)
Homes on Market: 5,989 (vs. 5,815 in 2025)
Average Days on Market: 52 days (vs. 54 days in 2025)
Pending Sales: 1,748
Local Market Breakdown by County & Region
Across the entire combined market area, overall inventory showed steady growth year-over-year while homes sold experienced a moderate adjustment.
Homes Sold: 1,264 (vs. 1,351 in 2025)
Median Sale Price: $305,000 (vs. $315,000 in 2025)
Homes on Market: 5,989 (vs. 5,815 in 2025)
Average Days on Market: 52 days (vs. 54 days in 2025)
Pending Sales: 1,748
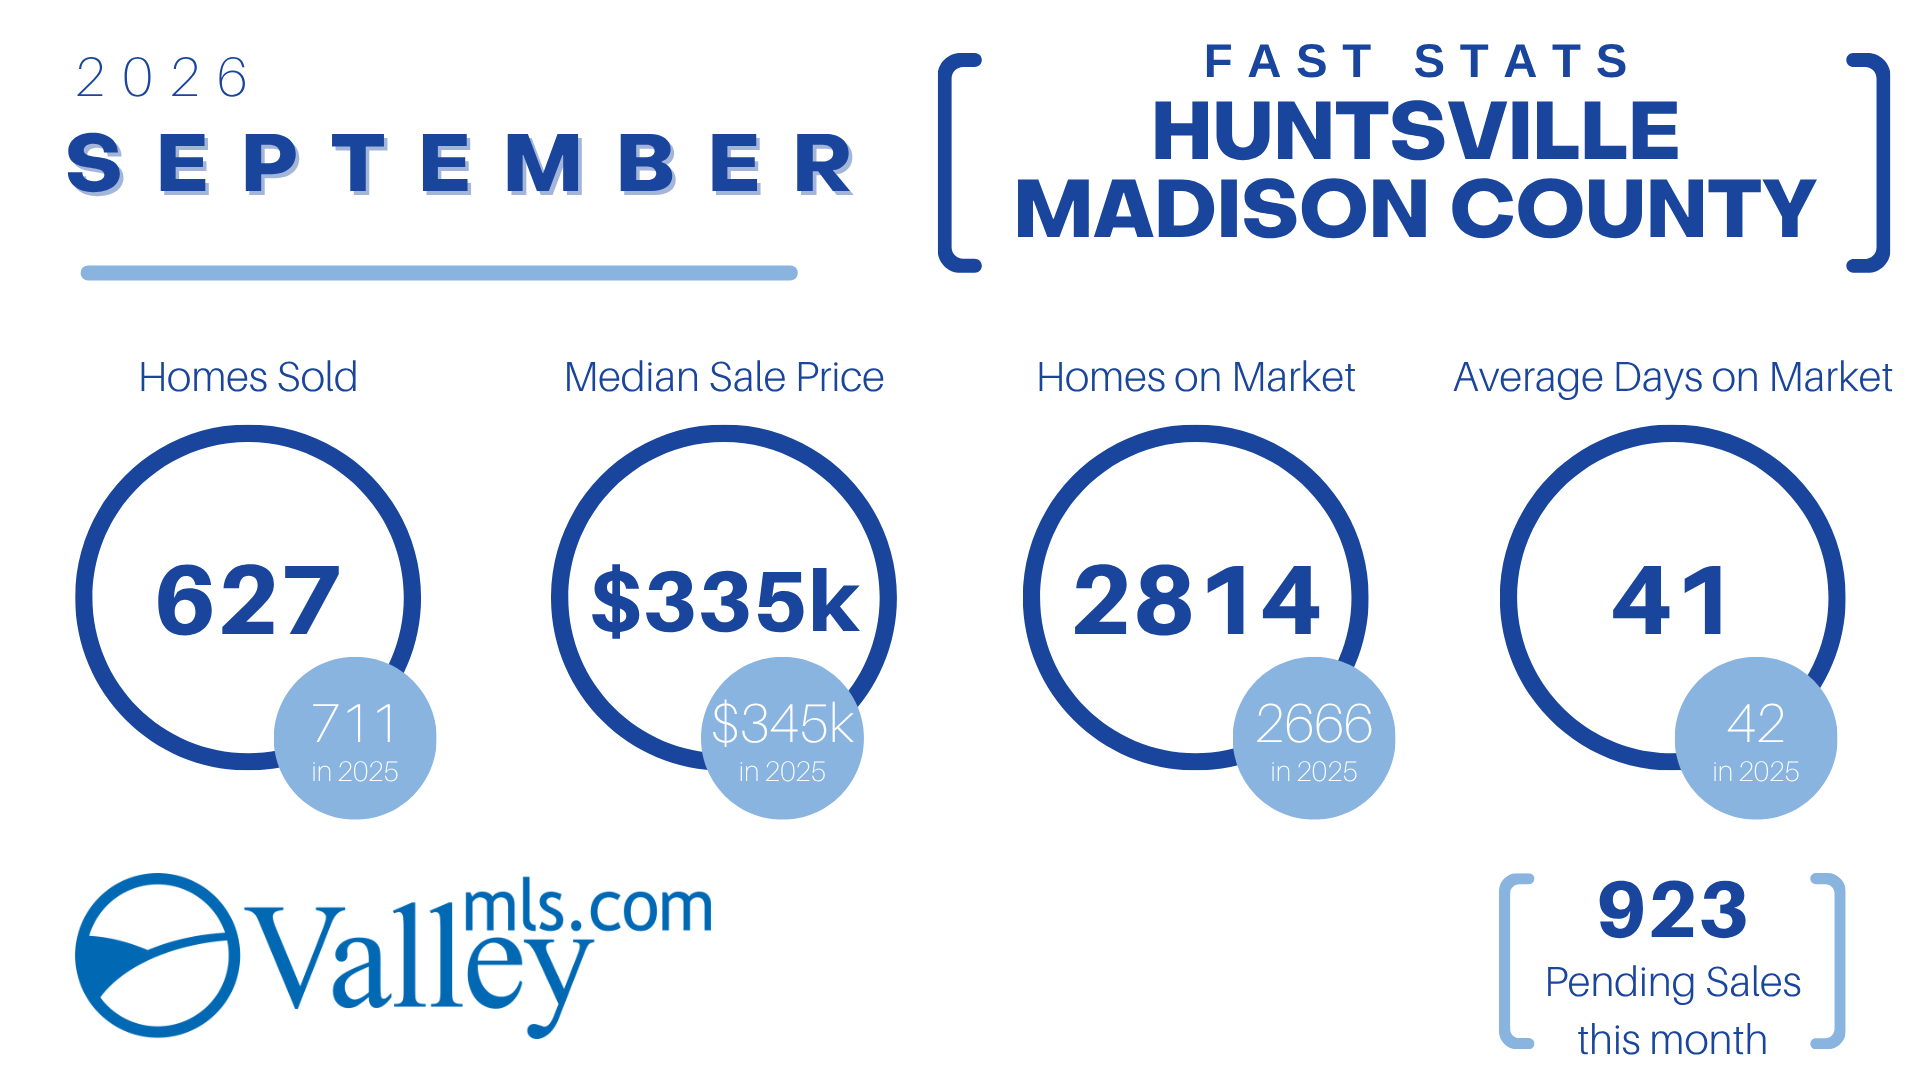
Huntsville & Madison County
Madison County saw a slight cooling in overall sales volume alongside expanded listing options for prospective buyers.
Homes Sold: 627 (vs. 711 in 2025)
Median Sale Price: $335,000 (vs. $345,000 in 2025)
Homes on Market: 2,814 (vs. 2,666 in 2025)
Average Days on Market: 41 days (vs. 42 days in 2025)
Pending Sales: 923
Athens & Limestone County
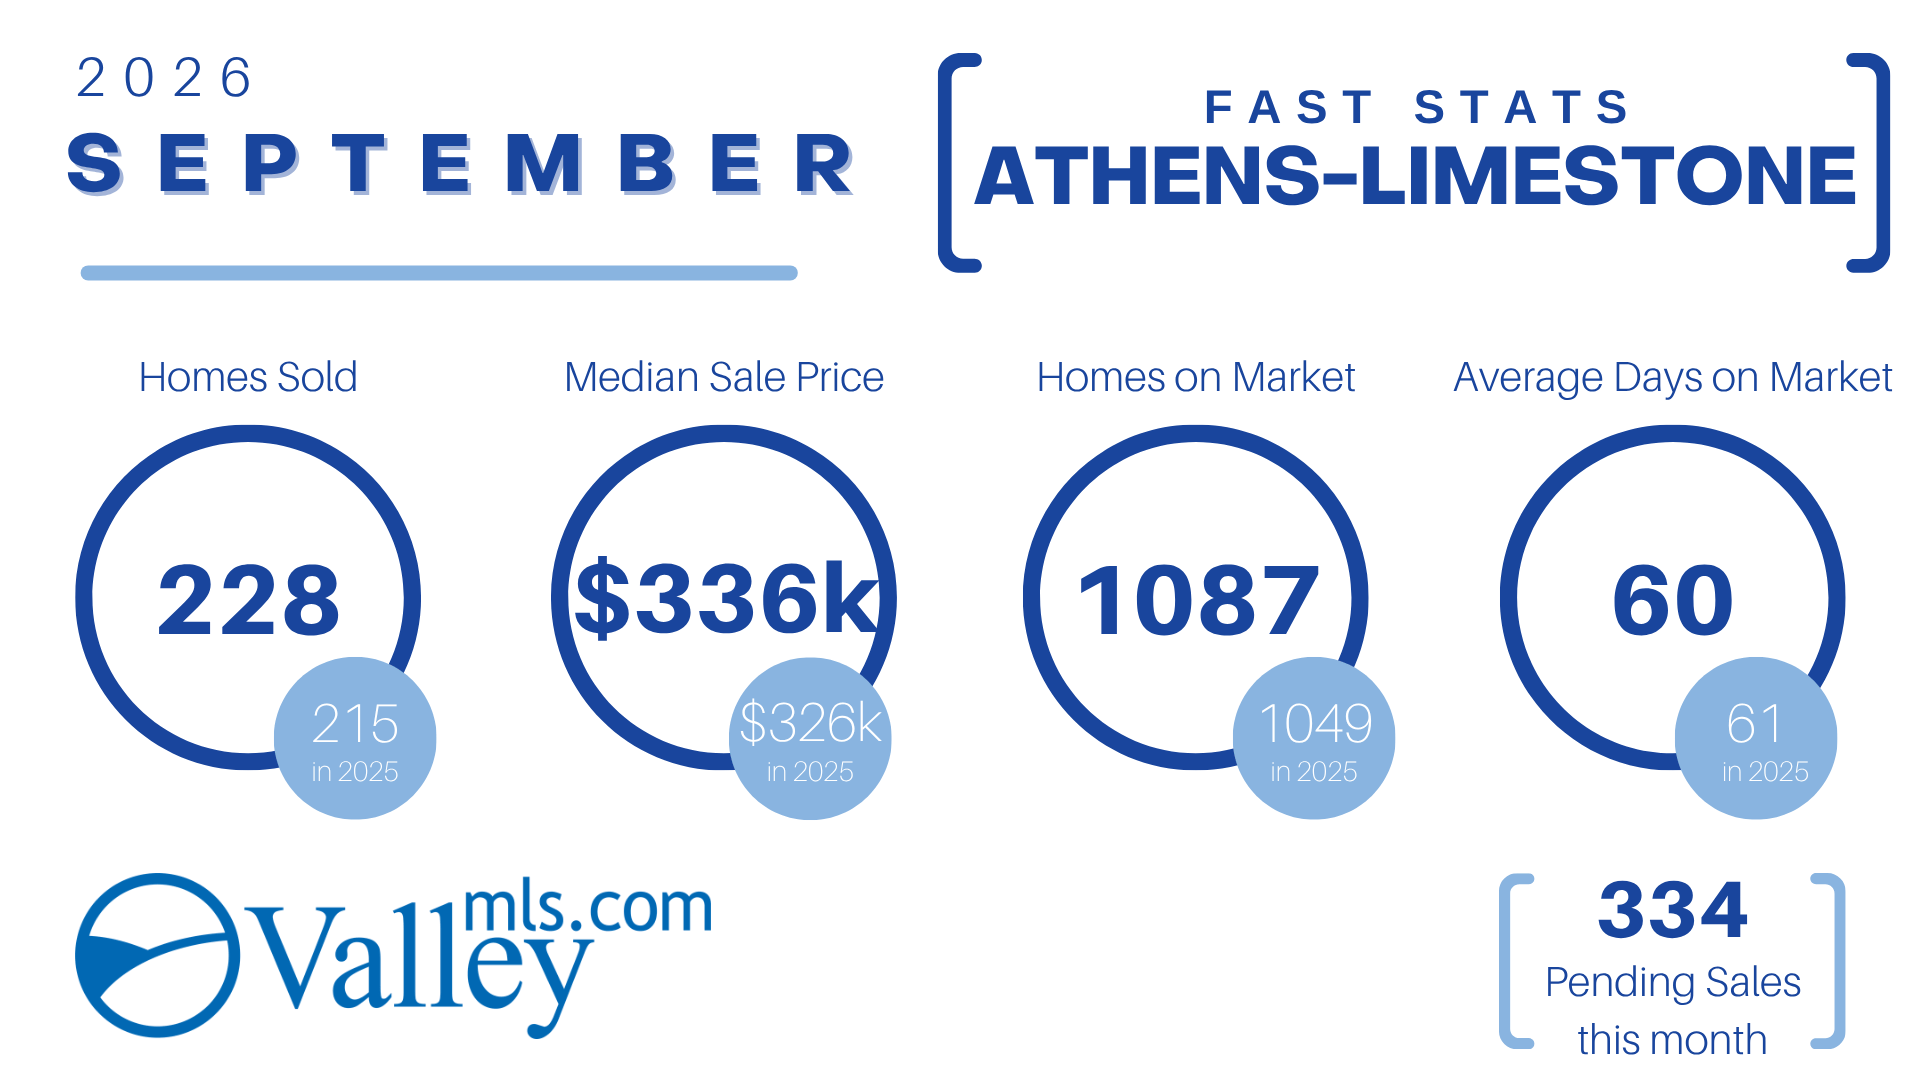
Limestone County displayed strong momentum with gains in both completed home sales and overall median sale prices.
Homes Sold: 228 (vs. 215 in 2025)
Median Sale Price: $336,000 (vs. $326,000 in 2025)
Homes on Market: 1,087 (vs. 1,049 in 2025)
Average Days on Market: 60 days (vs. 61 days in 2025)
Pending Sales: 334
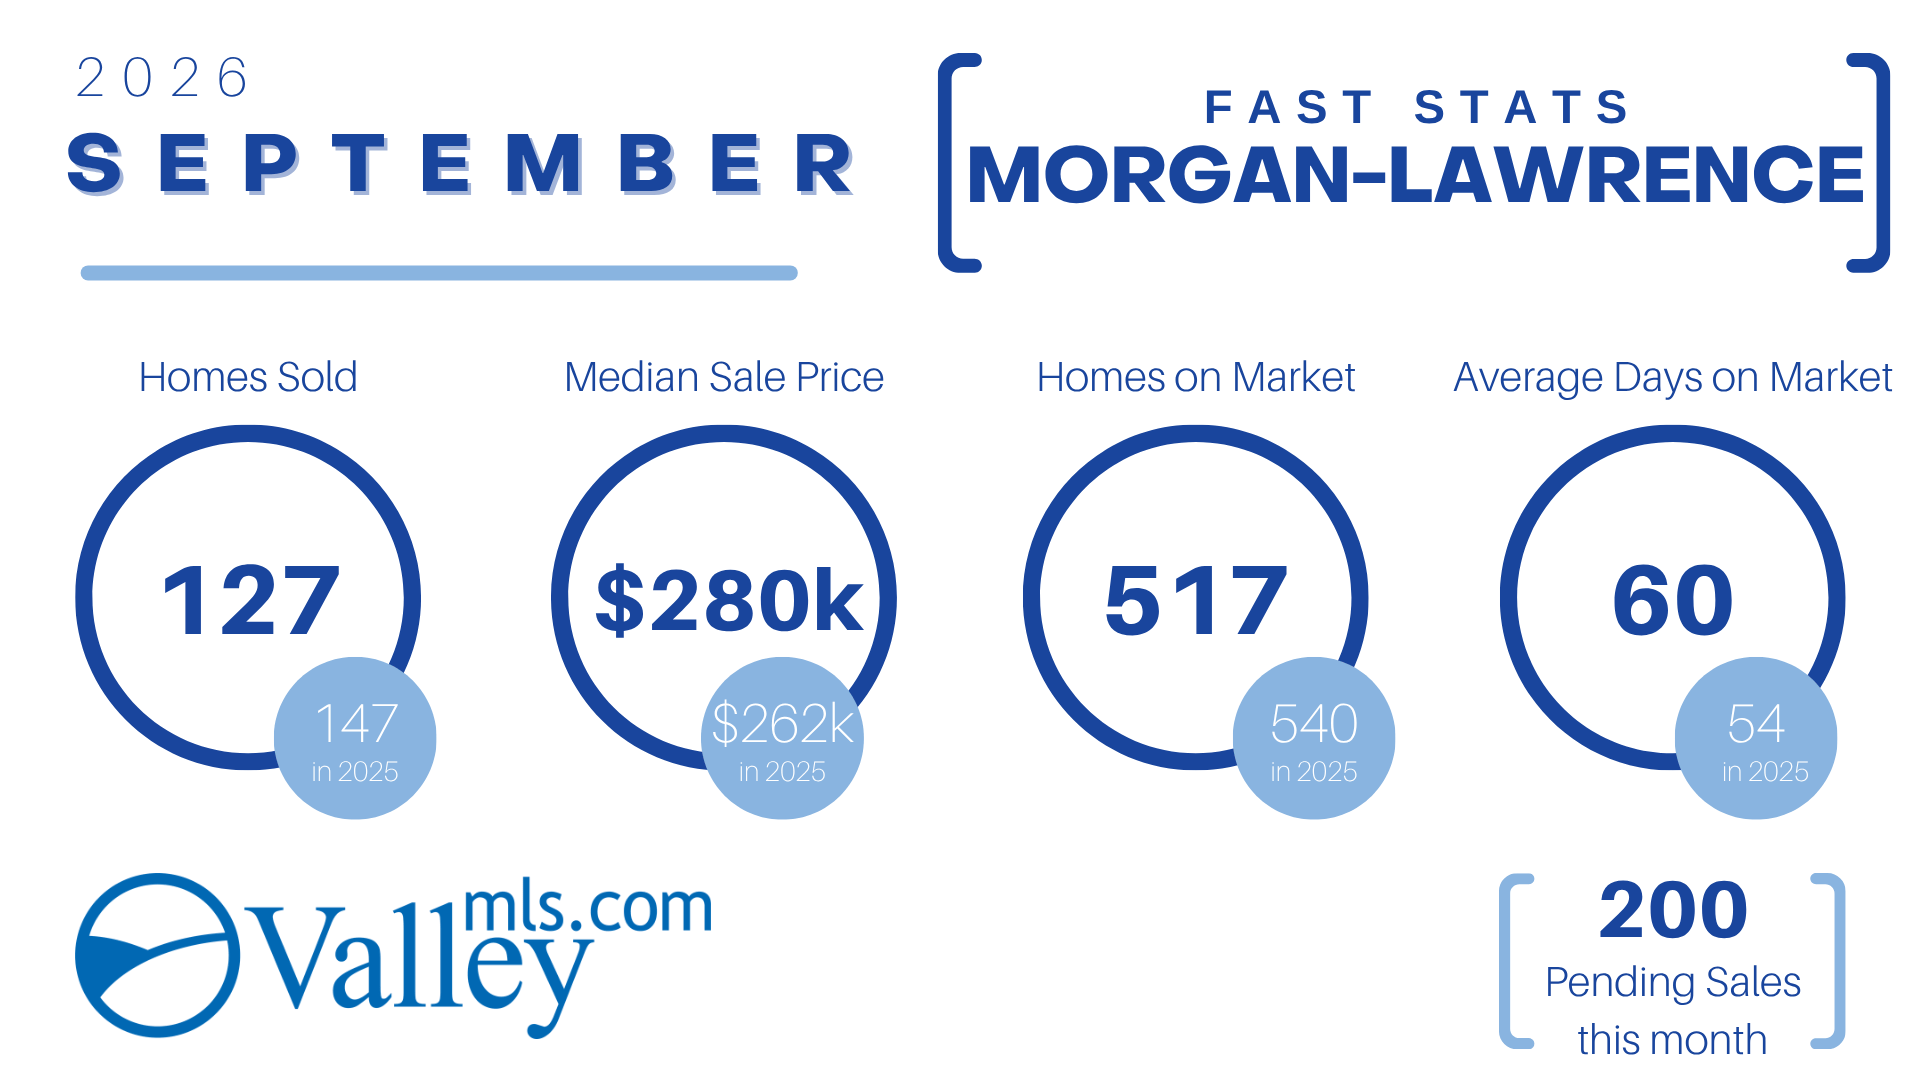
Morgan & Lawrence Counties
Morgan-Lawrence counties posted solid price growth while maintaining active transaction levels.
Homes Sold: 127 (vs. 147 in 2025)
Median Sale Price: $280,000 (vs. $262,000 in 2025)
Homes on Market: 517 (vs. 540 in 2025)
Average Days on Market: 60 days (vs. 54 days in 2025)
Pending Sales: 200
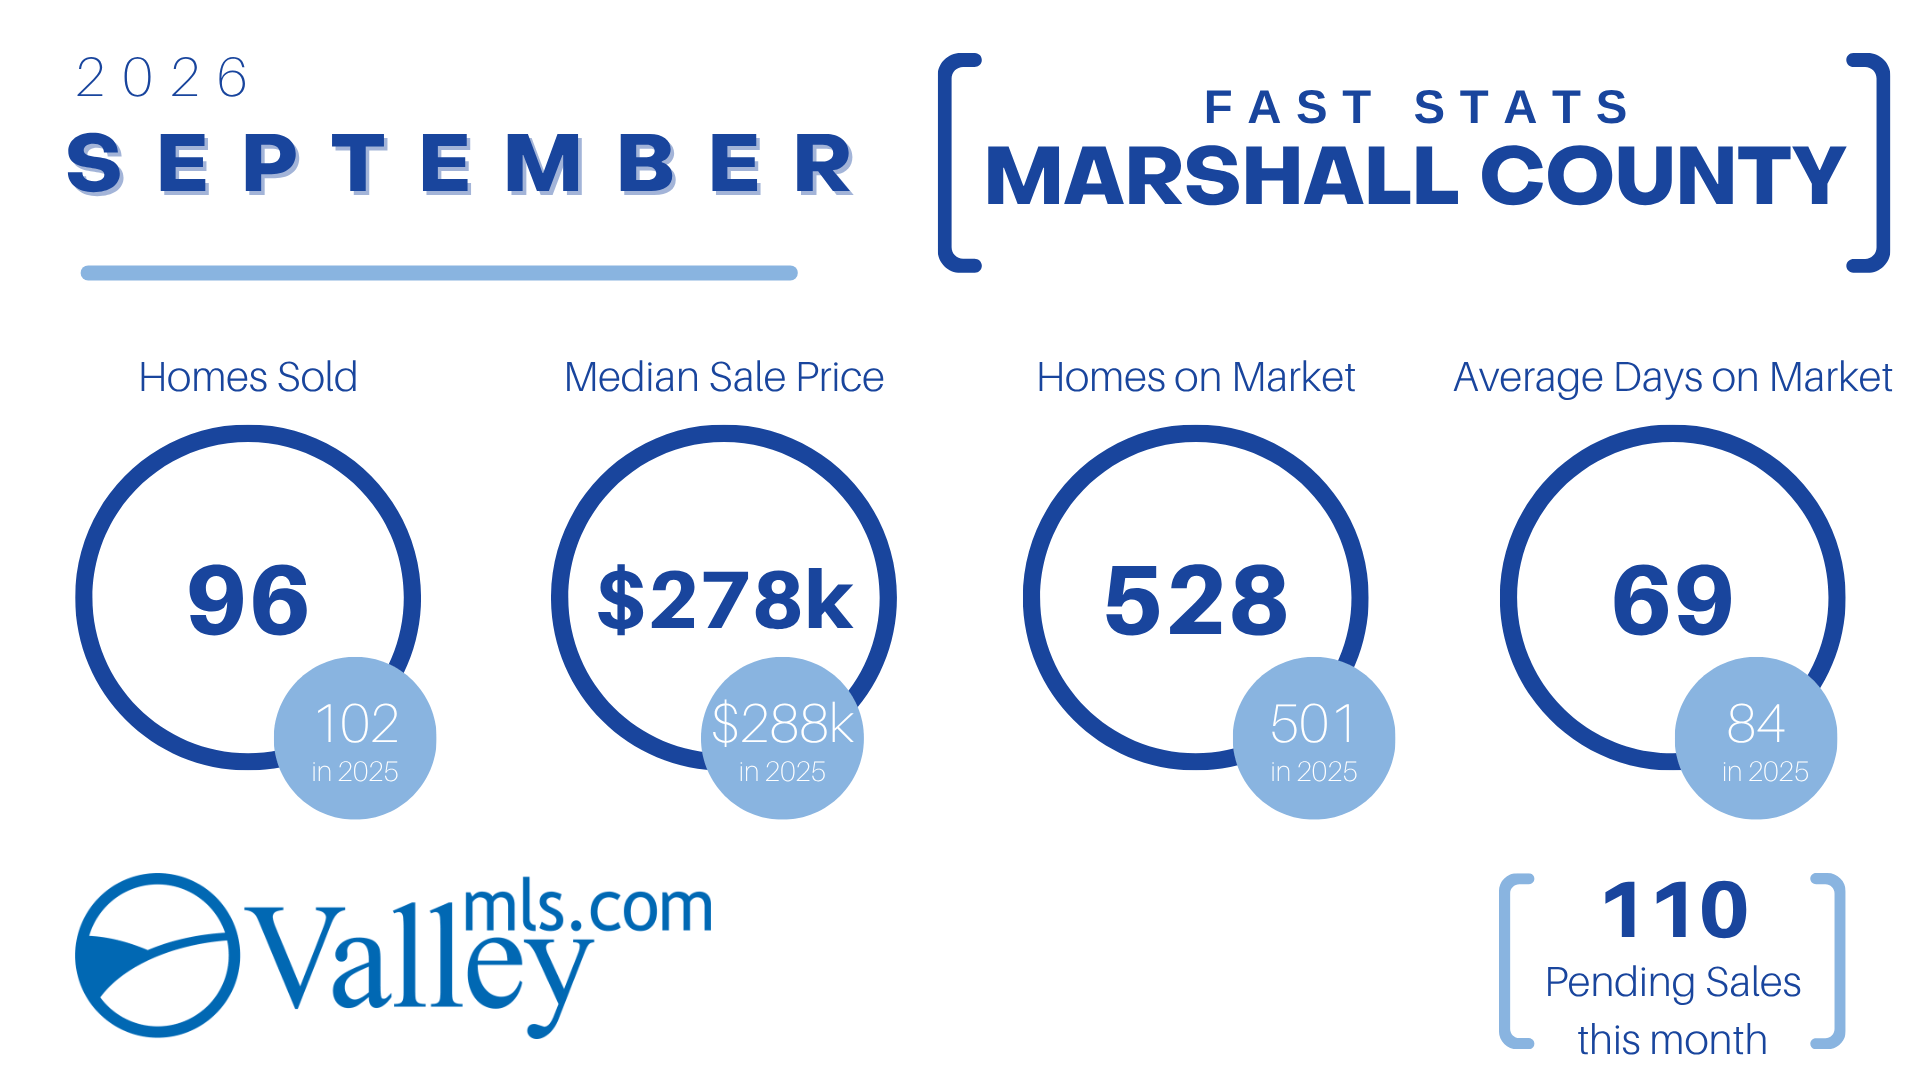
Marshall County
Marshall County inventory continues to expand steadily, with selling times improving compared to last year.
Homes Sold: 96 (vs. 102 in 2025)
Median Sale Price: $278,000 (vs. $288,000 in 2025)
Homes on Market: 528 (vs. 501 in 2025)
Average Days on Market: 69 days (vs. 84 days in 2025)
Pending Sales: 110
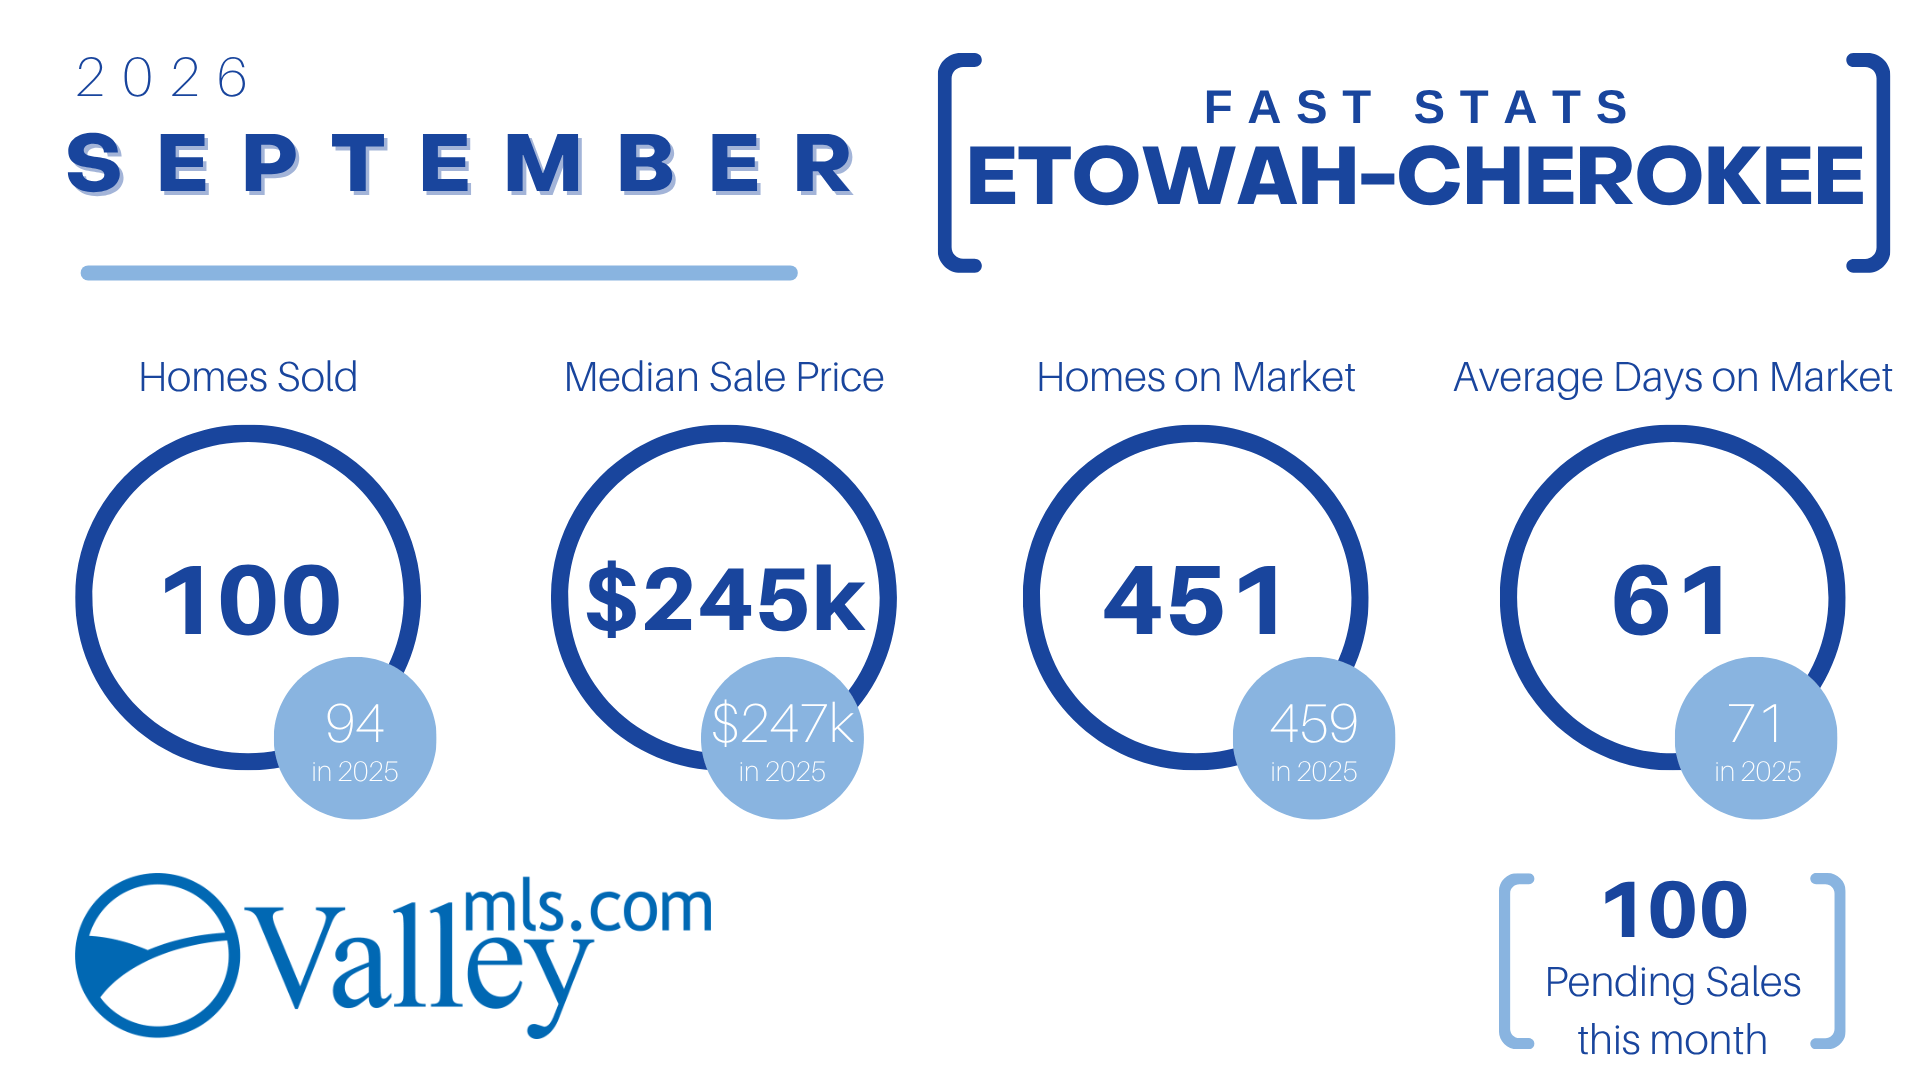
Etowah & Cherokee Counties
Etowah-Cherokee counties demonstrated gains in sales activity along with faster market velocity.
Homes Sold: 100 (vs. 94 in 2025)
Median Sale Price: $245,000 (vs. $247,000 in 2025)
Homes on Market: 451 (vs. 459 in 2025)
Average Days on Market: 61 days (vs. 71 days in 2025)
Pending Sales: 100
DeKalb County
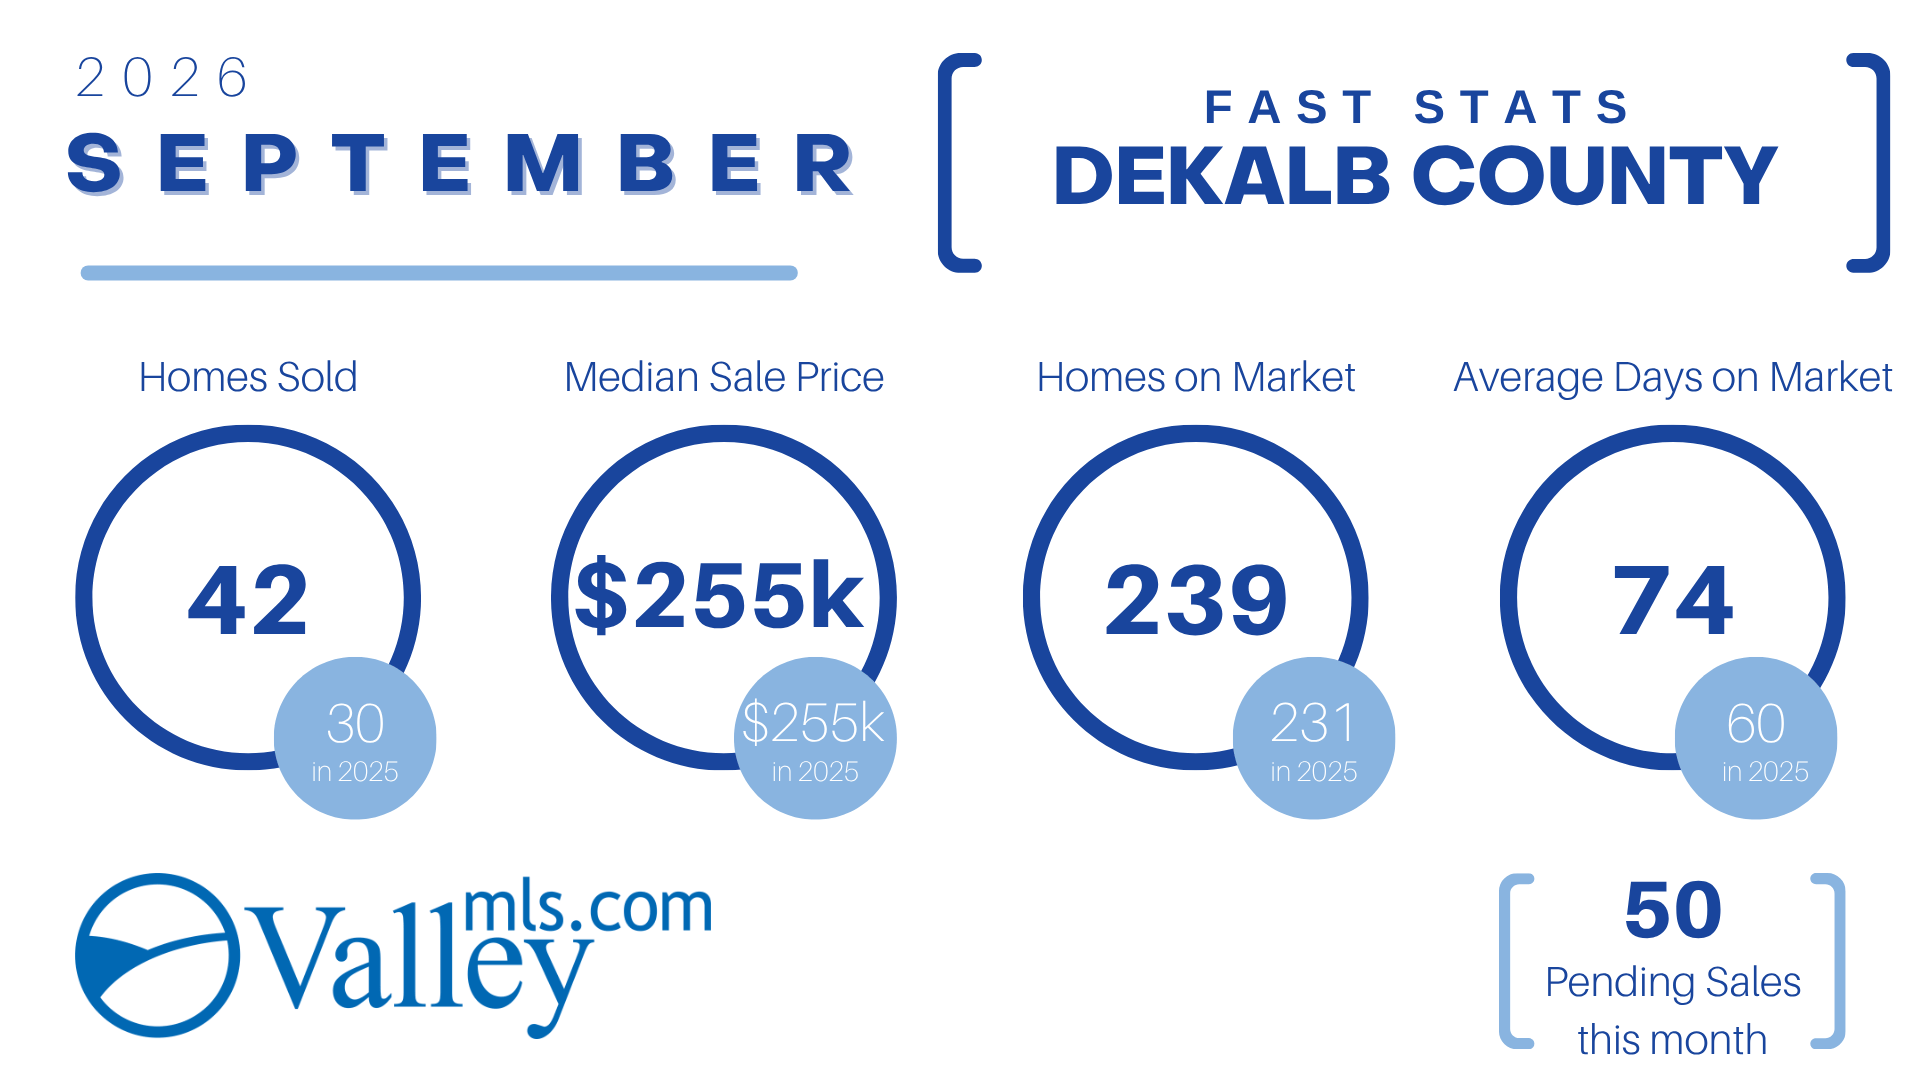
DeKalb County logged a significant rise in home sales compared to September 2025 while price points held firm.
Homes Sold: 42 (vs. 30 in 2025)
Median Sale Price: $255,000 (vs. $255,000 in 2025)
Homes on Market: 239 (vs. 231 in 2025)
Average Days on Market: 74 days (vs. 60 days in 2025)
Pending Sales: 50
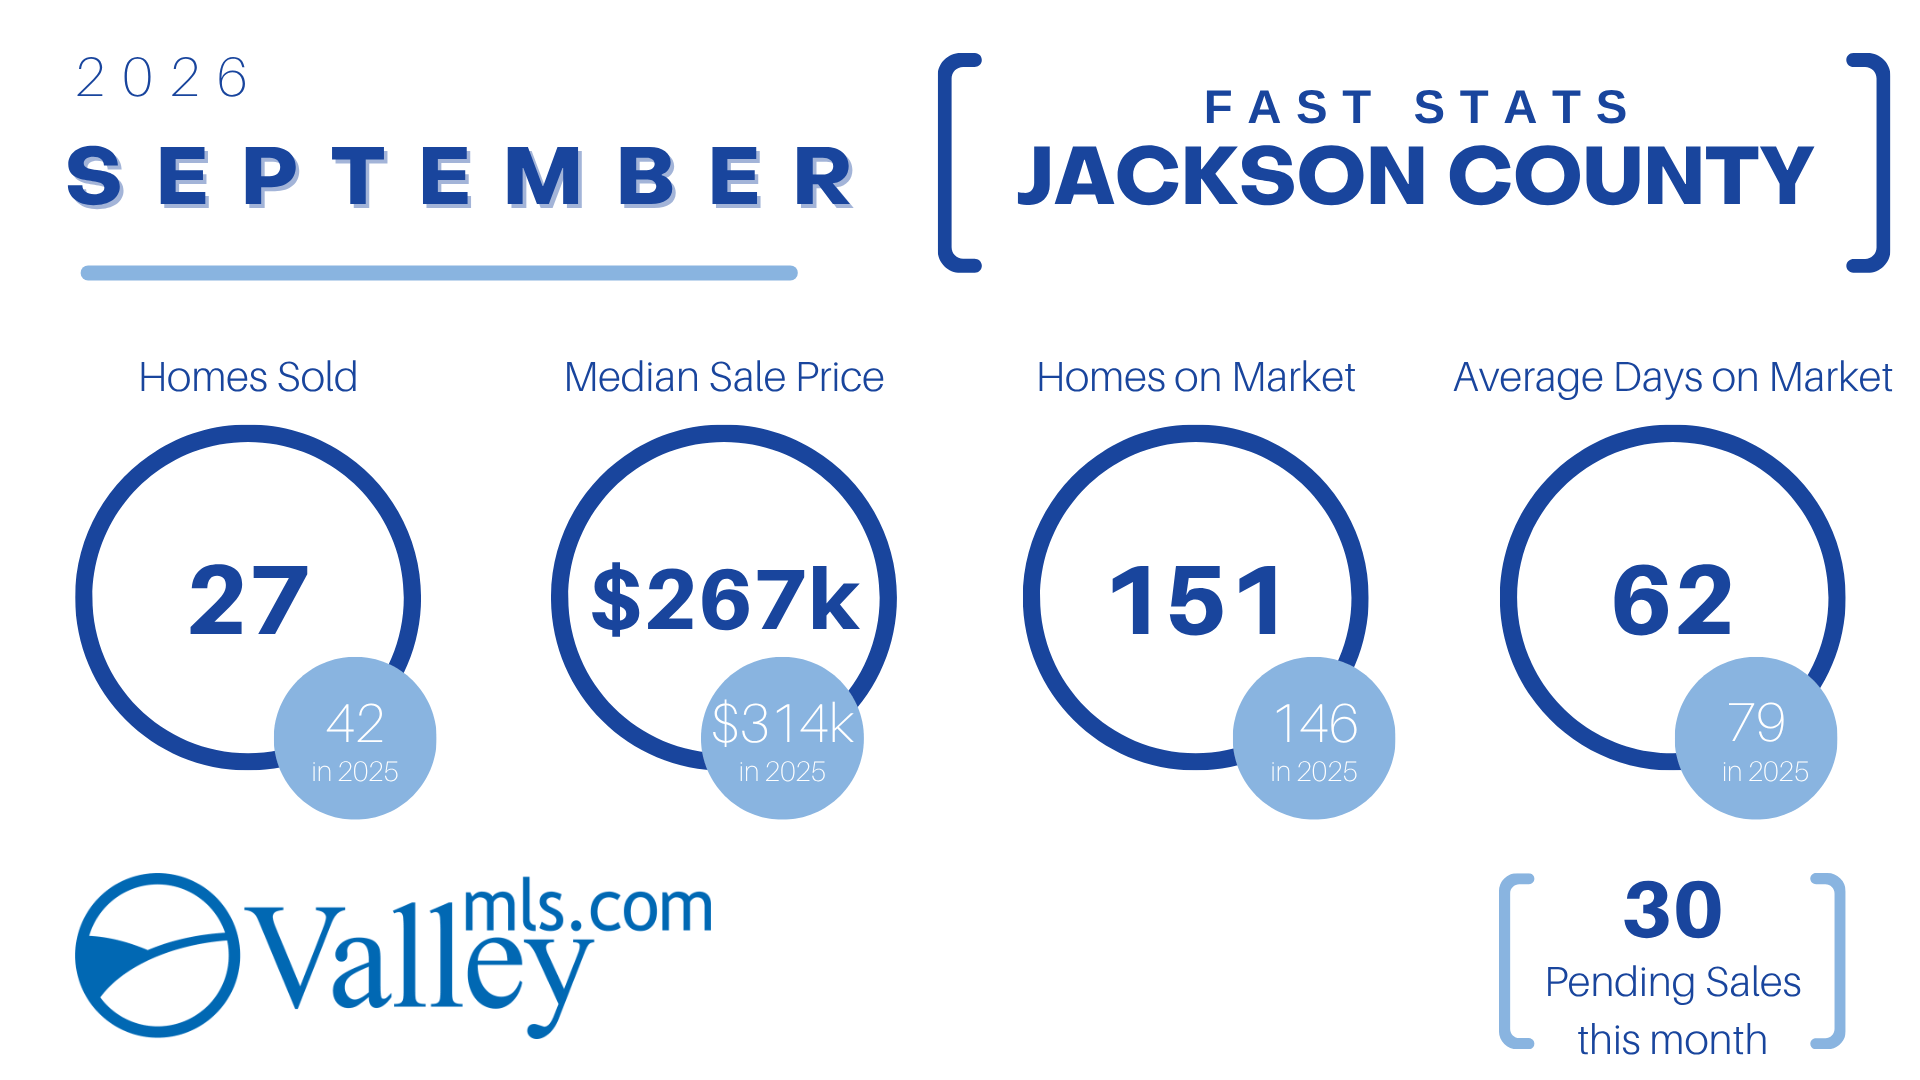
Jackson County
Jackson County saw faster market movement with average days on market decreasing by over two weeks.
Homes Sold: 27 (vs. 42 in 2025)
Median Sale Price: $267,000 (vs. $314,000 in 2025)
Homes on Market: 151 (vs. 146 in 2025)
Average Days on Market: 62 days (vs. 79 days in 2025)
Pending Sales: 30
Key Takeaways for REALTORS®
Rising Inventory Trends: Total active inventory across the combined market grew to nearly 6,000 listings, giving buyers expanded opportunities across North Alabama.
Pricing Variations: While regional median prices shifted down slightly from $315,000 to $305,000 year-over-year, submarkets like Limestone County ($336k) and Morgan-Lawrence ($280k) saw notable price growth.
Pace of Sales: Homes are staying on the market for an average of 52 days region-wide, holding relatively steady with last year’s performance.
To access more market reports and agent resources, visit the HAAR Member Portal or check market details directly on ValleyMLS.com.