2023 Annual Recap
Inventory of listed homes rose significantly in all price levels compared to 2022 levels. The number of units sold declined for all homes priced below $800,000 with the greatest percentage decrease occurring in the less than $150,000 price range. Only 4% of the total homes sold in 2023 are priced less than $150,000. Rising home values may cause the price range of less than $150,000 to shrink even further in Madison County and create housing affordability issues for low-income families. While the future is unknown; home sales should remain strong but may continue to moderate in the new year. Increasing levels of available homes suggest that buyers should not only have more to choose from but could enjoy more moderate prices. Even though the overall inflation rate decreased to 4.1% in 2023, it was still challenging for homebuyers and homeowners. The local economy seemed resilient and the demand for housing remained strong. The number of units sold in December 2023 ticked upwards (owing tto a slight fall in mortgage rates), compared to the number of units sold in October and November of 2023. With interest rates stabilizing but remaining relatively high we can expect to see some moderation in home purchases in the coming months
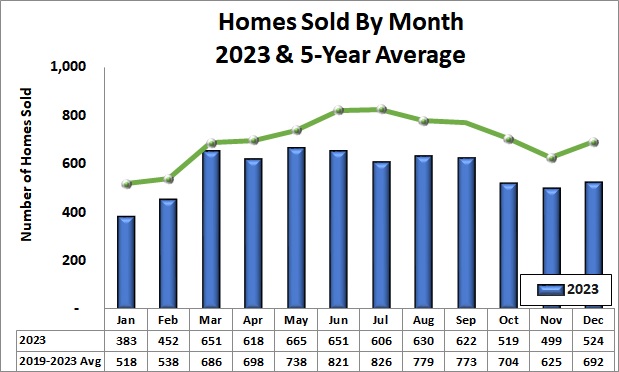
Figure 1 shows the annual number of homes sold (blue columns) and the average interest rate for 30-year conventional mortgages. Madison County showing strong economic growth and attracting many businesses that has kept the housing market strong. However, the surge in mortgage rates and a simultaneous increase in home prices, in 2022 and 2023, after a few years of low rates, has affected housing affordability. With the sharp increase in inflation and interest rates and subsequent mortgage interest rates in 2022 and 2023, sales are exhibiting a downward trend.
Sales, Inventory, DOM, Median Prices
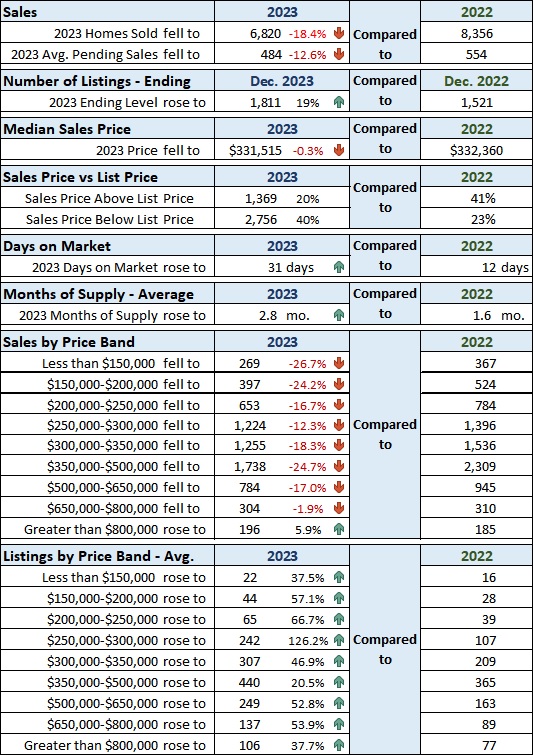
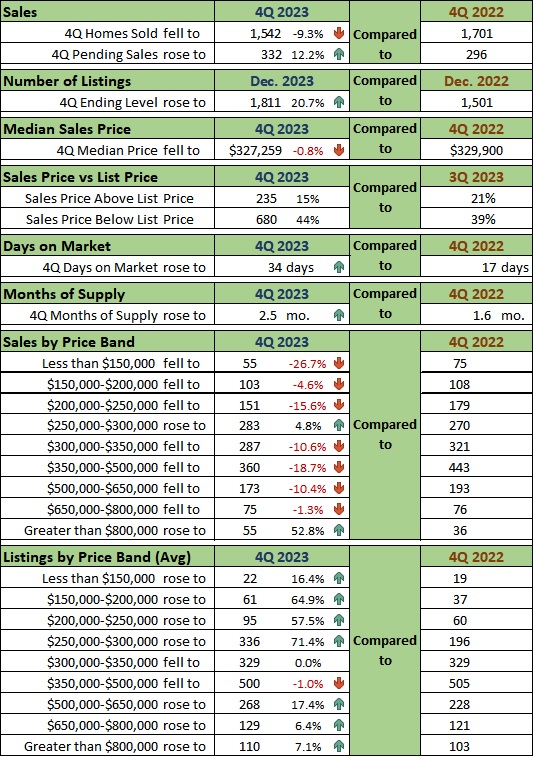
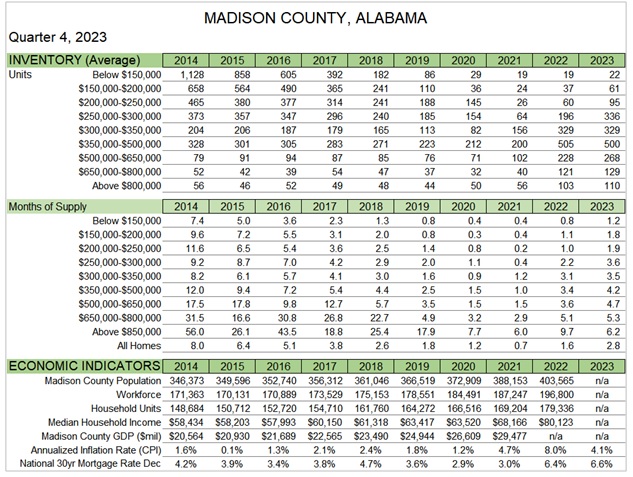
The total number of units sold was 6,820 in 2023 which was 18.4% less than the 8,356 in 2022. 66% of homes sold in 2023 were existing homes and 32% were new construction. In 2023 20% of the homes sold were above list price versus 40% of homes sold were below the list price. See Table 1.
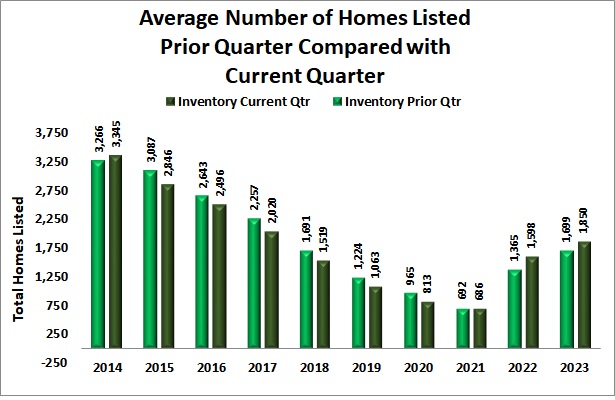
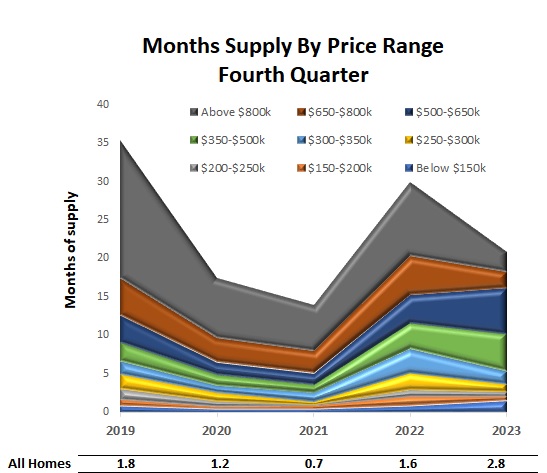
The number of homes listed increased in 2023 in all price ranges compared to 2022. See Table 1.
Average days-on-market for the year was 31 days, over 150% more than the 12 days-on-market in 2022. See Table 1.
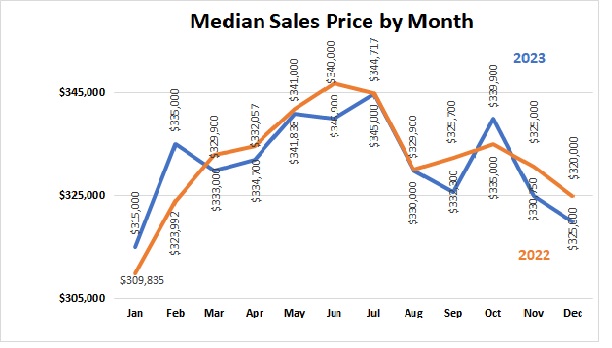
The median sales price of all homes slightly decreased to an annual median of $331,515.
The greatest number of homes sold (1738) were priced between
$350,000 and $500,000. Annual sales of homes decreased in all price bands except homes priced more than $800,000 (196) in 2023 compared to 2022. Sales of homes priced less than $150,000 saw the largest percentage decrease at 27%.
Listings of homes available for sale rose significantly in all price levels. The largest average number of homes listed (440) for the year was for homes priced between $350- $500,000. See Table 1.
Units Sold
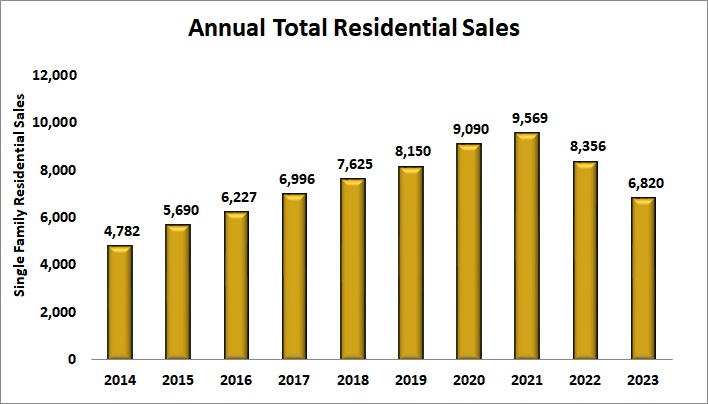
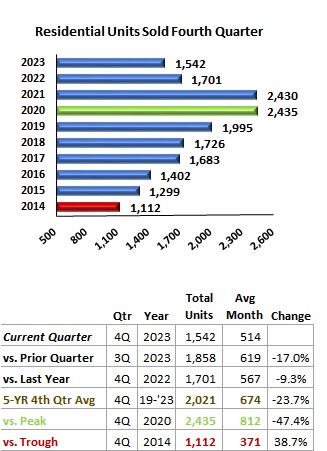
The total number of residential units sold in 2023 (6820) was around 18% below the 2022 level and 29% below 2021, which was the peak, but 43% more than 2014 level (4782). The annual number of units sold has risen each year from 2014 to 2021. This was the second drop in the annual number of units sold since 2014. See Figure 2
Sales Price Levels
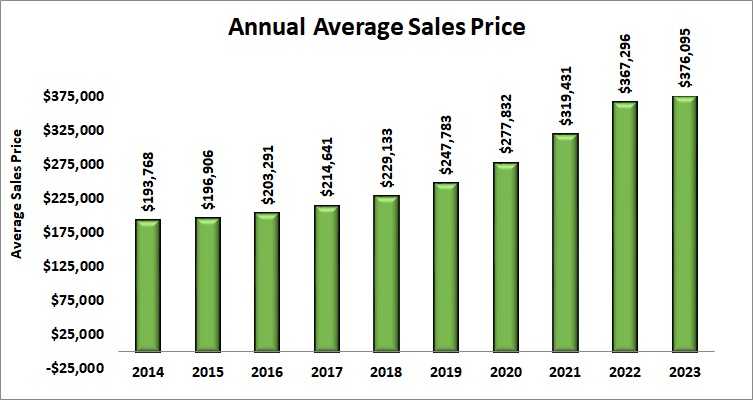
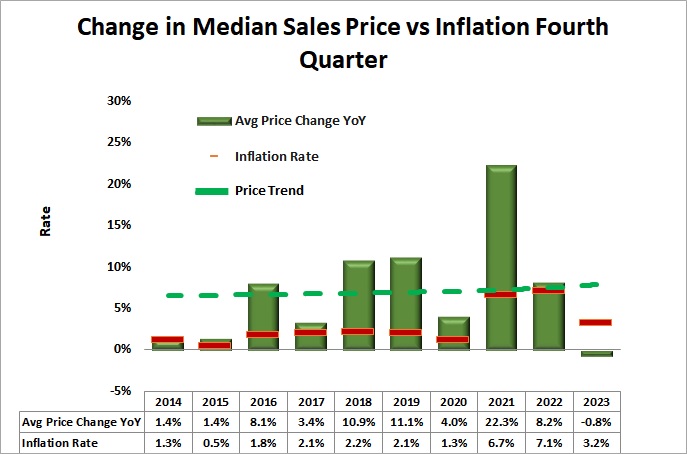
Average sales price levels in 2023 continued their rise reaching an average price of $376,095. The annual average sales price rose 2.4% above 2022. Since 2014, the average sales price has increased by 94%. See Figure 3.
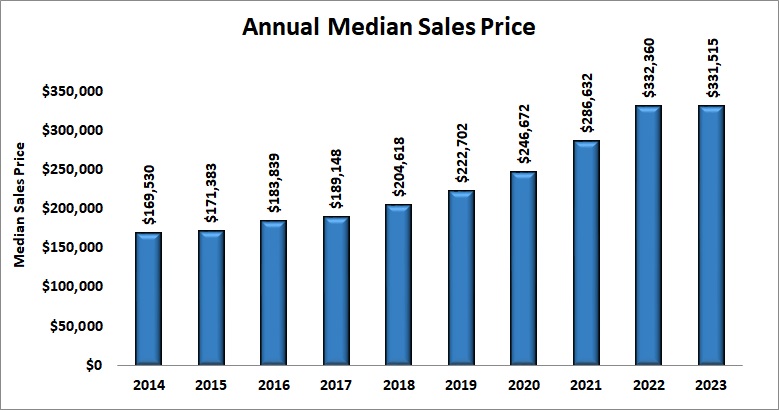
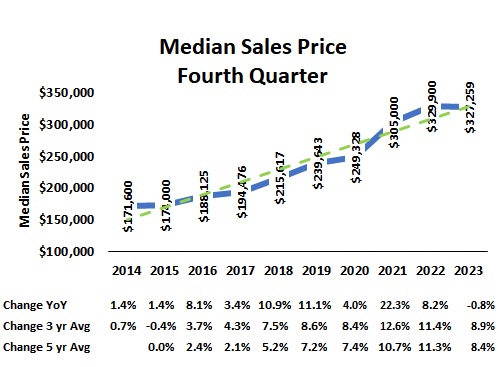
Median price $331,515 which was slightly less than the 2022 level. The median sales price represents the price point at which about 3410 homes sold at a lower price and 3410 homes sold at a higher price in 2023. Annual median levels increased by 95% compared to 2014. See Figure 4
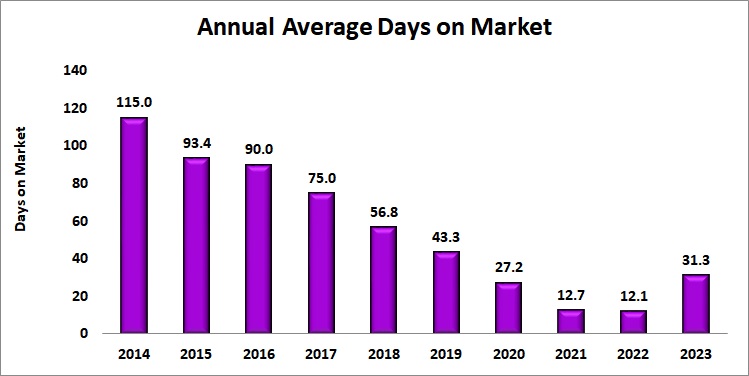
Days on Market
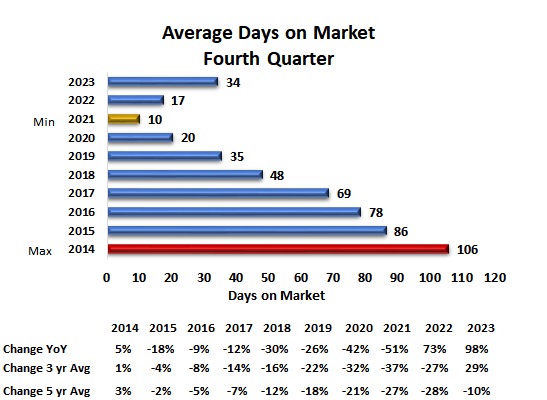
Number of days-on-market (DOM) is a measure of the length of time a home is listed for sale. In 2023, the annual average days-on-market almost tripled compared to 2022’s 12.1 days. It was 15% higher than in 2020. However, it is around 70% less than the 2014 level (115 days). This was the first increase in DOM since 2014. See Figure 5
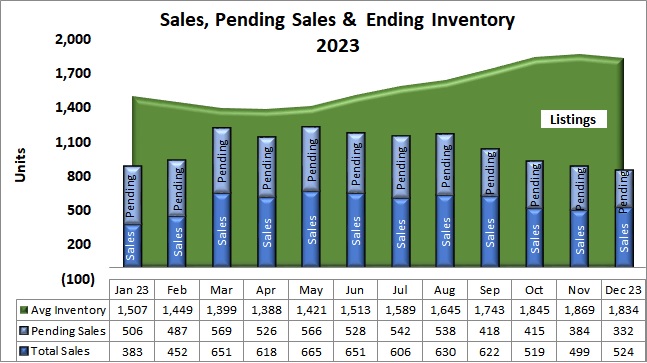
Sales and Inventory
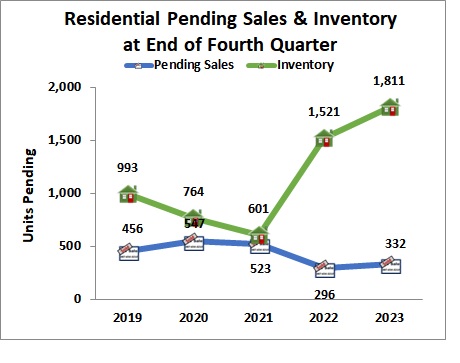
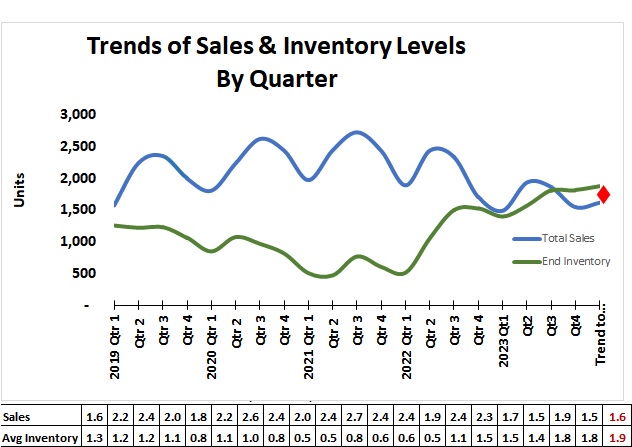
Home sales for the year totaled 6,820 with the monthly peak occurring in May. The total number of monthly sales are less than the average number of listed homes for all months in 2023. The monthly average inventory was greatest in November at 1,869 homes. See Figure 6. Total pending sales peaked in March at 569. December pending sales (332) was the lowest level in 2023
Annual Summary
Inventory of listed homes continued to grow in all months in 2023 compared to 2022. The total number of units sold was 6,820 in 2023 with the total value of $2,570,554,199 which was 18.4% less than the 8,356 in 2022. 66% of homes sold in 2023 were existing homes and 32% were new construction.
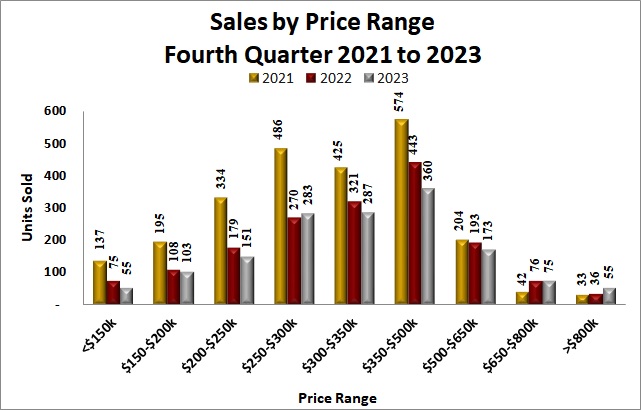
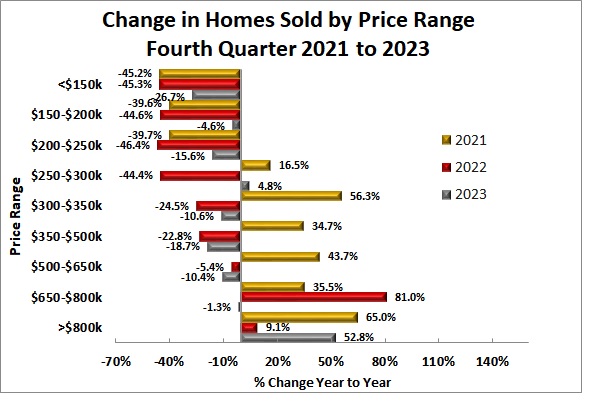
The increase in home prices pushed sales and inventory of listed homes into higher price ranges resulting in fewer homes available in the under $150,000 price range. Sales, in this price range, in 2022 were 367 homes and 269 in 2023 which was down 26.7%. Average listings, in this price range, went up 37.5% to 22 from 16. However, it was still the lowest of all price bands. This shift toward higher price ranges affects housing affordability and accessibility especially for low-income families. However, the annual median sale price fell slightly and coupled with strong economic growth in the region first-time home buyers may still be able to afford a home
Q4 Insight
The inventory of homes (1811) rose around 21% at the end of December 2023. Median sales price slightly decreased to $327,259 in 4Q 2023.
Average days on market increased to 34 days in the fourth quarter. Total 1542 homes sold in 4Q 2023.
Fifteen percent of homes sold were above list price this quarter while 41% sold at the asking price. The number of sales below the asking price was 44%.
The average inflation rate for the quarter was 3.2%.