


The first quarter of 2019 saw continued growth of quarterly home sales during January through March. Often times, we think of the home sales season beginning in the Springtime, however in the Huntsville Area the “spring market” came early this year. The total sales for the first quarter of 2019 set another record at 1,567 homes sold which was above the 1,524 homes sold during the first quarter of 2018. Homes with a sale price between $150,000 and $200,000 became the range with the largest number of sales for the first time. Sales of homes in the under $150,000 category declined by 24% from the first quarter 2018 level. Record low inventory and increased sale prices are contributing to these changes in sales.
The average sale price (the total volume of homes sold divided by total of all homes sold) increased by 8.3% to $235,610, while the median sale price (midpoint of all homes sold) increased by 8.8% to $208,333. Average days on market dropped 25.5% to 55 days on market, the lowest recorded since 2010. In the $150, 000 – $200,000 range (Madison County’s highest demand sale price) the inventory dropped to 1.3 months of supply in that price band in Q1 2019.
A simple trends analysis predicts continued pressure on low inventory driving prices upward. The report suggests a widening of the gap between the number of buyers looking for a home and the number of homes available.
Now is a great time to contact a local Realtor® to begin your home search or sale today. Find a Realtor®. Find a Home @ www.ValleyMLS.com
You can read the full report below or download it HERE.
First Quarter Recap
The new year saw a continued growth of quarterly home sales during January through March. The total sales for the first quarter set another first quarter record at 1,567 homes sold which was above the 1,524 homes sold during the first quarter of 2018. During the 1st Quarter, homes priced between $150,000 and $200,000 comprise the largest number of sales at 385 or 25% of all sales for the first time reflecting the continuing increase in Median and Average Sales Prices. Sales of homes in the under $150,000 category declined by 24% from the first quarter 2018 level and the sales of homes in the $150,000-$200,000 homes increased by 12.6%. The fewest number of homes sold continued to be in the $300,000-$350,000 price range. Figures 1 & 2.
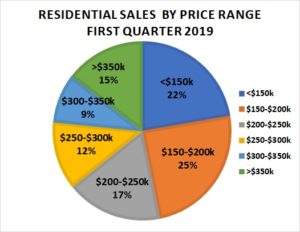
Figure 1
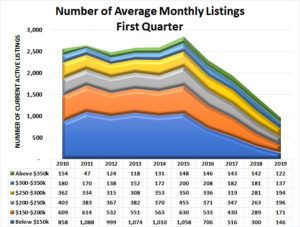
Figure 2
Average and Median Sales Prices year-over-year rose more than 5% compared to the first quarter of 2018. The 2019 price levels were higher than in any first quarter since 2010. Average Sales Price for the first quarter 2019 sales was $235,610. The Median Sales Price reached $208,333, another all-time level.
The number of pending sales at the end of the 1st Quarter was virtually the same level as at the end of 2018 which may suggest the market was functioning at capacity.
There appears to be downward pressure on sales volume and upward pressure on prices from the unusually low inventory. With the sales-to-inventory ratio of 2.4, an expansion of new and new to market homes will soon be needed to maintain the record sales volume levels.
Report Content
I. Sales & Price Levels
II. Market Momentum
III. Inventory Status
IV. Demographics
V. Local Area Outlook
VI. Other Economic Insight
VII. Data Sources
I. Sales & Price Levels
Residential Sales
Residential home sales in the first quarter of 2019 continued to grow, but at a slower rate than between first quarter 2017 and 2018. Total homes sold in January, February, and March was 1,567…up 2.8% from January-March. The five-year average sales level increased 13.5% quarter to quarter in 2019.
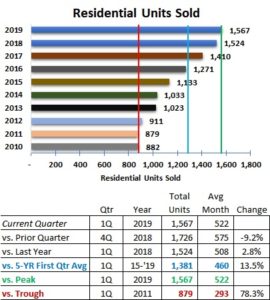
Figure 3
The vertical green line in Figure 3 represents the peak level of sales between 2009 and 2019 for the 1st quarter. The blue vertical line represents the five-year 1st quarter average number of sales of 1,381. The red line represents the lowest number of homes sold at 879 experienced in 2011.
Seasonality of Sales
The sales in January, February, and March 2019 continued to be above the 5-year average levels. The monthly sales volume trend appears to be tracking the monthly average levels for sales. See Figure 4.
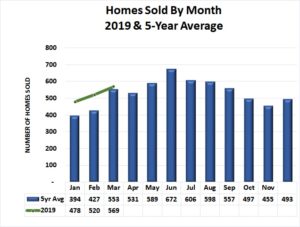
Figure 4
Sales Volume by Price Range
Homes with sale prices between $150,000 and $200,000 became the range with the largest number of sales for the first time reflecting the continuing increase in Median and Average Sales Prices. Sales of homes in the under $150,000 category declined by 24% from the first quarter 2018 level. The fewest number of homes sold continued to be in the $300,000-$350,000 price range.
The largest percentage increase in sales occurred in the $350,000 and above price range at 24% above the first quarter 2018. Sales in all other price ranges increased quarter over quarter with $250,000-$300,000 growing the least at 7.8%. See Figure 5.
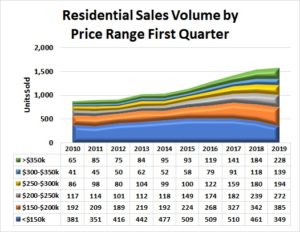
Figure 5
Average Sales Prices
The average sales price for all homes sold during the 1st Quarter 2019 was $235,610, an 8.3% increase from the 2018 1st Quarter average selling price of $217,503. See Figure 6.
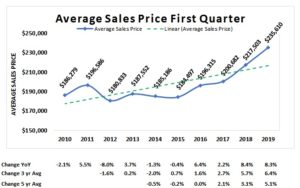
Figure 6
Median Sales Price
The median (midpoint) sales price in Madison County for the 1st Quarter of 2019 reached $208,333, an 8.8% increase from the 1st Quarter 2018. The five-year average sales price grew by 5.8% in the past year. See Figure 7.
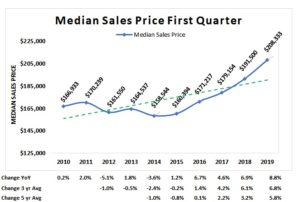
Figure 7
II. Market Momentum
Days on Market
The average number of days on the market (DOM) in the 1st Quarter of 2019 dropped to 55 days, the lowest DOM (red line) for a 1st Quarter since 2010. This is a drop of 25.5% from 2017. The greatest DOM 1st Quarter level was reached in 2014 (green line) at 124 days with the five-year average DOM at 94 days (blue line). See Figure 8.
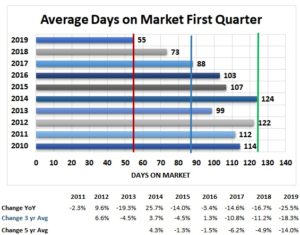
Figure 8
Months of Supply
Months of Supply of homes available for sale continued to drop in all six price bands. Homes with sales prices below $150,000 has the lowest available inventory at 1.3 months which only slightly lower than the 1.4 months for homes in the $150,000-$200,000 range. See Figure 9.
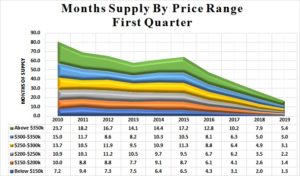
Figure 9
Pending Sales
At the end of the 1st Quarter 2019 there were 497 sales pending to be closed, an increase of 55.2% from the end of the 1st Quarter 2018. This is the largest number of sales pending since 2011 and is marked with the green vertical line.
The lowest level (red vertical line) of sales pending occurred in 2011 with 161 sales pending. The five-year average number of sales pending (blue vertical line) for 1st Quarter was 296 units. See Figure 10.
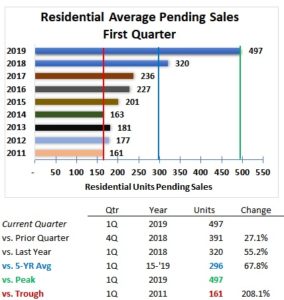
Figure 10
III. Homes for Sale Inventory Status
Homes for Sale
The average number of residential units available for sale at the end of the 1st Quarter of 2019 decreased to 1,519. This level is up 21% from the end of 2018, but the inventory of homes for sale continues to decline. See Figure 11.
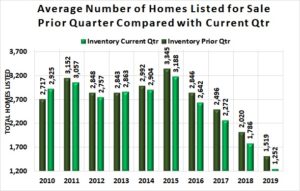
Figure 11
The number of homes listed for sale (green line) in Figure 11 at March 31, 2019 dropped 52.7% from March 31, 2018. The number of sales pending (blue line) remained fairly steady at the end of the first quarters in 2011 through 2014 but has grown each year since to 497 homes by March 31, 2019. See Figure 12.
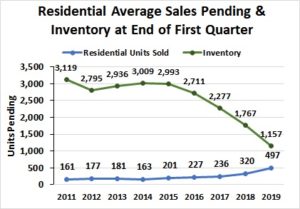
Figure 12
Figure 13 shows the average number of listings by price range for each 1st quarter period since 2011. The greatest decrease in the monthly average number of homes listed for sale this quarter from the 1st Quarter 2018 was in homes with a sales price below $150,000 (51.3% or a drop of 154 homes) from the 1st Quarter 2018.

Figure 13
Inventory-to-Sales Ratio
The quarterly average number of homes listed for sale (inventory) divided by the current quarterly average sales results in a metric of 2.4 houses available for sale for each house sold in the 1st Quarter. See Figure 14.
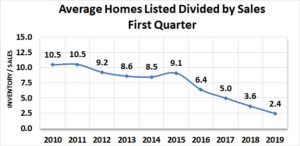
Figure 14
IV. Key Demographics
Real estate activity is subject to many forces including the number of people needing housing, their ability to purchase, and the confidence they have in the stability of their future income. The economic strength of the region represented by the area’s Gross Domestic Product (GDP) may also provide insight into the future of the real estate industry.
Madison County Population & Workforce Trends
Population of Madison County as counted by the U.S. Census Bureau has grown rapidly since the 2010 census. The population in 2010 was 334,811 persons. The most recent annual estimate of Madison County’s total population shows a 9.5% increase to 366,519 in 2018. See the blue line in Figure 15.
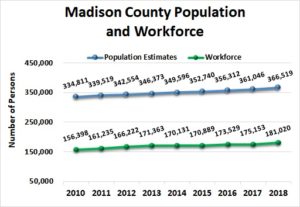
Figure 15
The workforce is comprised of the number of people working and looking for work. The annual workforce (green line) has also risen since 2010 by 15.7% to reach 181,020 in 2018.
Households
The number of households represents the number of housing units of all types needed in the Madison County area. Households may be comprised of nuclear families, extended families, individuals living alone as well as housing for unrelated roommates. Housing units should generally move in relation to population, but not always at the same rate – there may be lag.
The number of housing units in Madison County, Alabama grew from 147,085 in 2010 to an estimated 161,760 in 2017 (the most recent year data is available) per the U.S. Census Bureau. This is an increase of 10% over the eight-year period. See Figure 16.
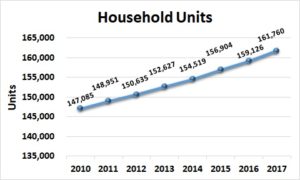
Figure 16
Average Household Income
The Average Household Income suggests an income level in the region that could be used to estimate housing affordability. Overall, the Annual Average Household Income in current dollars has grown significantly (12.1%) since 2010. A slight drop in 2015 more than recovered to $83,287 in 2017 (the most recent year data is available). See Figure 17.
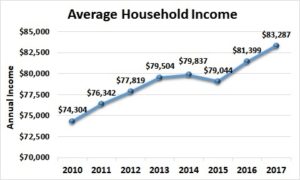
Figure 17
Gross Domestic Product – Huntsville Metropolitan Statistical Area
Gross Domestic Product is the sum of all goods and services produced in the region. The Huntsville Metropolitan Statistical Area is comprised of Limestone and Madison Counties, Alabama.
Gross Domestic Product for the Huntsville MSA grew by 17.8% from 2011. Gross Domestic Product reached $25.8 billion dollars in 2017 (the most recent year data is available) which is a growth of 4% from 2016. See Figure 18.
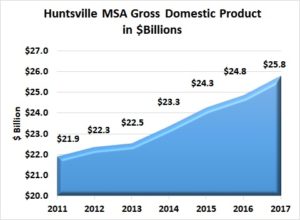
Figure 18
V. Local Area Outlook
Sales & Average Inventory Trends
Average inventory of homes available for sale (green line) continues its downward trend and the number of units sold (blue line) also continues its upward trend. As the gap between average inventory and sales widens, there will be upward pressure on prices.
Figure 19 suggests that there is downward pressure on volume and upward pressure on sales prices from the unusually low inventory. These pressures could bring more homes on the market or slow sales or both. A simple growth trend calculation (dotted line) suggests that sales could reach approximately 1,900 units on inventory of 1,300 if the current trends continue. Note that a shock to the economy could occur on any given day and would affect demand for or supply of homes or both.
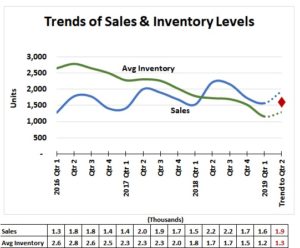
Figure 19
VI. Other Economic Insight
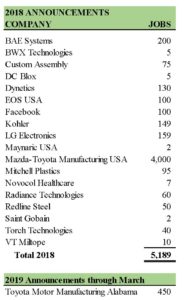
Madison County Job Announcements
Economic development announcements of new and expanding industry are the result of the local community working to grow the economy. It should be noted that the number of jobs announced may be realized over several years while the new or expanded plant is built and employees are hired. The economic development announcements for 2018 in Huntsville (includes Madison County and areas of Limestone County) are below.
VII. Data Sources:
• Alabama Department of Labor
• Chamber of Commerce of Huntsville/Madison County
• Huntsville Area Association of Realtors Quarterly Reports
• U.S. Bureau of Economic Analysis
• U.S. Census Bureau
• Valley MLS System
Analysis & Report Prepared By:
• Brinda Mahalingam, Ph.D., Economist
• Jeff Thompson, Project Director
Questions regarding this report should be directed to:
Jeff Thompson, jeff.thompson@uah.edu, 256.361.9065
Click HERE to download the Huntsville Area Real Estate Economics Report – First Quarter 2019