“Supply & Price” Drive Local Market in First Quarter
Posted on 05/17/2020
If you would like your company’s branding placed on this report to distribute to your clients or colleagues, please email Daniela Perallon your request with a high resolution logo at Daniela@valleymls.com.
Sales continued at record levels in Q1, but below Q4 of last year.
Average Months of Supply across all pricepoints sits at 1.3 months, but only 15 days for $150k-200k pricepoint despite dip in sales for the latter.
365 homes sold at $350k pricepoint, nearly identical to the 366 sold in the $200k-$250k range.
$350k pricepoint saw largest sales increase (+137) and sharpest drop in supply at 300.
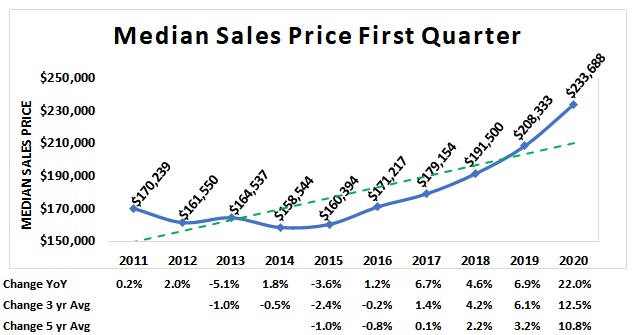
Q1 Median Sales Price higher than same period last year at $233,688.
The residential real estate market in Madison County in the first quarter 2020 can be described in two words—Supply and Price. Demand continued to be strong through the end of March unlike many other sectors of the economy. The supply of homes did not grow as fast as demand which resulted in an increase in prices especially in the $200,000 to $300,000 range. The number of homes above $350,000 saw the largest sales increase (137) as well as the largest drop in supply (300).
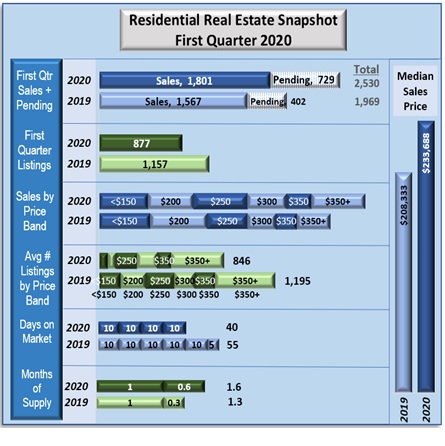
First Quarter 2020 metrics include:
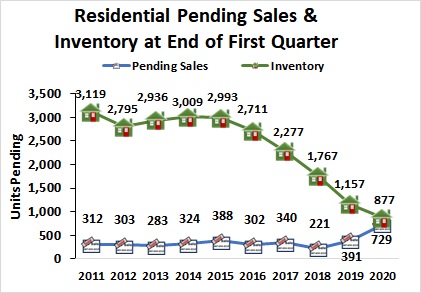
Sales: Increased to a record level 1,801 with 729 sales pending compared to 1,567 and 402 respectively in 2019.
Median Sales Price: Rose to $233,688 compared with $208,333 in 2019 and $191,500 in 2018.
Inventory: Declined to a record low 877 homes compared to 993 in December 2019 and 1,157 in March 2019
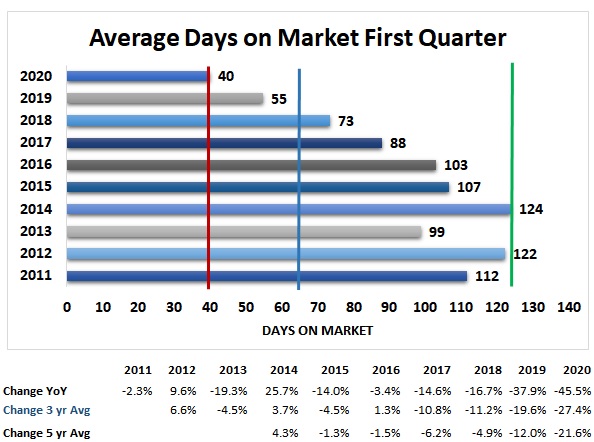
Days on Market: Dropped to a record low of 40 days compared to 55 days in 2019
Months of Supply: Increased slightly to 1.6 months from the 2019 first quarter low of 1.3 months
Figure 1
Sales Price Band:
Less than $150,000 sales fell to 331 (-5%) sales compared to 349 in 2019
$150,000-$200,000 sales fell to 310 (-19%) sales compared to 385 in 2019
$200,000-$250,000 sales rose to 366 (34%) sales compared to 272 in 2019
$250,000-$300,000 sales rose to 263 (36%) compared to 194 in 2019
$300,000-$350,000 sales rose to 166 (19%) compared to 139 in 2019
Over $350,000 sales rose to 365 (60%) compared to 228 in 2019
Inventory Price Band:
Less than $150,000 fell to 60 homes vs. 146 in 2019
$150,000-$200,000 fell to 56 homes vs. 171 in 2019
$200,000-$250,000 fell to 144 homes vs. 196 in 2019
$250,000-$300,000 fell to 138 homes vs. 194 in 2019
$300,000-$350,000 fell to 90 homes vs. 137 in 2019
Over $350,000 fell to 358 homes vs. 407 in 2019
Homes Sold
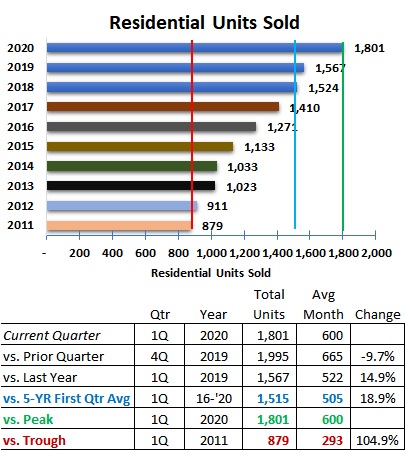
Sales continued at record levels in the first quarter 2020 but below the fourth quarter level of last year. The total units sold 1,801 this year is 14.9% above the 1,567 in the first quarter 2019 and more than twice the lowest first quarter total in 2011, which was a total of 879. See Figure 2.
The five-year average first quarter total sales increased to 1,515 which is 9.7% higher than the five-year first-quarter average of 1,381 in 2019.
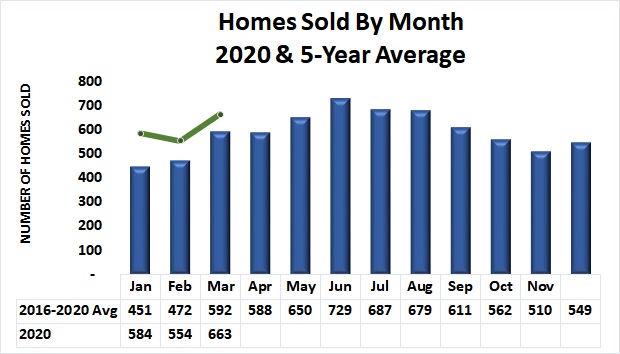
Homes Sold by Month
Comparing homes sold to the five-year monthly average shows that sales in 2020 sustained higher than normal levels from January through March. January’s actual sales of 584 was 29% above the five-year average January sales. February actual sales of 554 was 17% above the February average of 472. March sales (663) was 12% above average.
Figure 2
Median Sales Price
Prices are continuing to rise month-to-month as well in the first quarter of each year. The median sales price for the first quarter 2020 was $233,688, 22% higher than at the same period in 2019.
While there are monthly fluctuations, the overall price trend since 2014 is higher as shown in Figure 4.
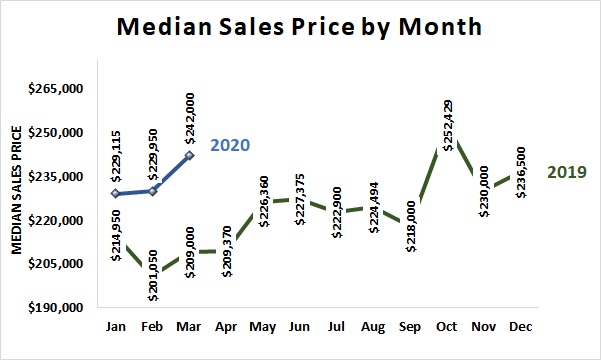
Figure 5 shows the median sales price by month since January 2019.
Figure 3
Figure 4
Figure 5
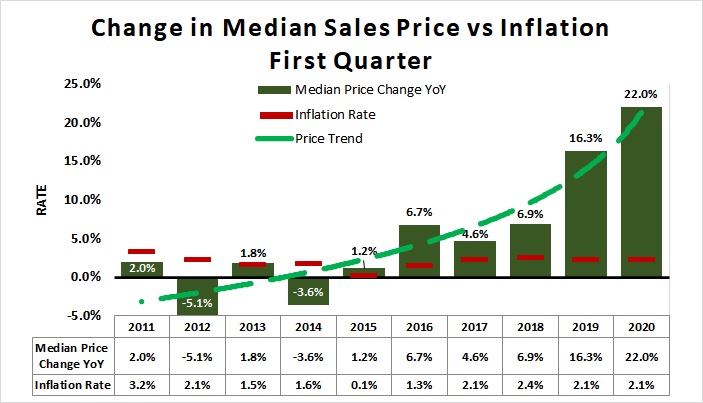
Home prices are rising much faster than other costs in the local economy represented by the inflation rate for all goods. Figure 6 compares the rate of change in the median sales price of homes (green columns) with the inflation rate (red lines) and the home price trend line (green dotted line).
Figure 6
Figure 7
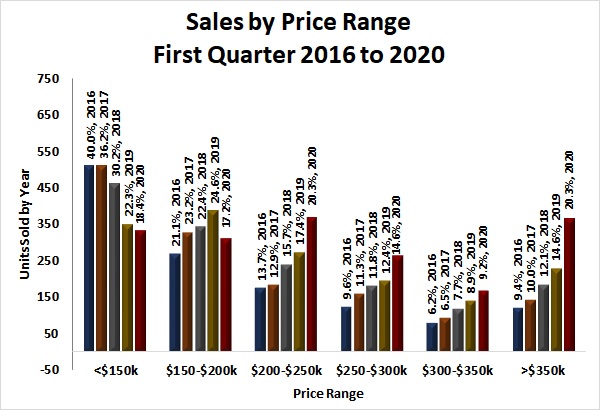
Sales Price by Range
The number of homes sold in the above-$350,000 price range (365) was virtually tied with the number of homes sold in the $200,000-$250,000 price range (366). Sales of homes priced below $200,000 dropped while the number of sales in the four higher-priced sales ranges rose between 9.2% and 20.3% in the first quarter. The largest drop in the number of sales was in the under-$150,000 range, down 35% from the 2016 level. In 2016, 40% of the sales were in the under-$150,000 range while in 2020 it was less than 19%. At the other end of the range, in 2016 9.4% of the sales were above $350,00 and now it is 20.3%. See Figure 7.
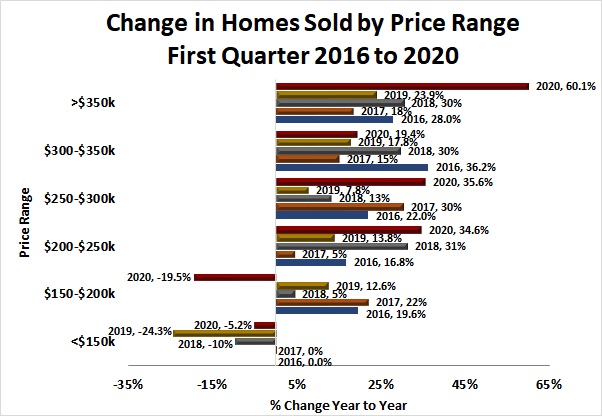
Quarter over quarter comparisons (Figure 8) shows the change in first quarter sales by year for five years. The greatest growth occurred in between 2019 and 2020 with a 60% increase in the number of above-$350,000 homes sold. The sale of homes priced between $200,000 and $250,000 increased 35% in 2020.
Reductions in the number of homes sold occurred in both price ranges under $200,000. The under-$150,000 range experienced a drop in the first quarter for the third year.
Figure 8
Figure 9
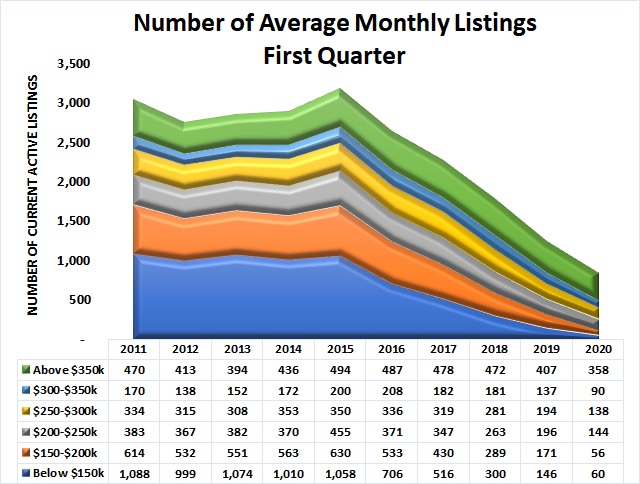
Inventory
The number of homes listed for sale continued to decline to record first quarter lows. Only 116 homes priced below $200,000 were listed in the first quarter 2020. The greatest number of homes listed for sale was in the above-$350,000 price range at 358. The $250,000-$300,000 price range had the second most with 144 homes listed. See Figure 9.
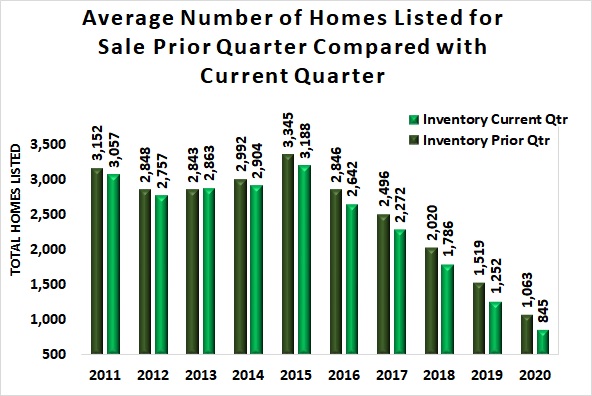
Comparing the inventory of homes quarter-to-prior-quarter shows the continuous drop in the number of homes available. There were only 846 homes available at the end of March 2020 compared to 1,063 at the end of December 2019. A significant reduction in inventory has been occurring since the highest level of available homes in the decade during 2015. See Figure 10.
Figure 10
Figure 11
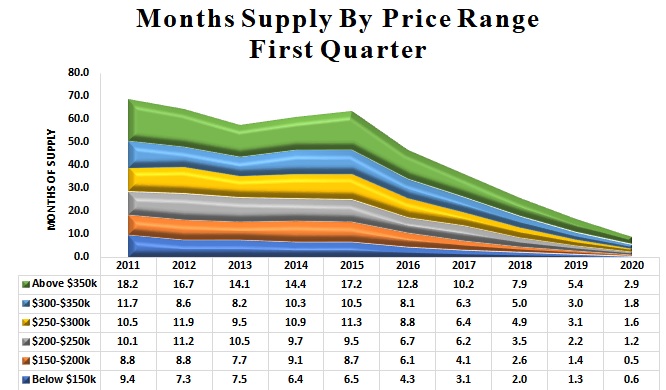
Months of Supply
The months-of-supply of homes at the end of the first quarter 2020 overall was 1.3 months but only 15 days for homes priced between $150,000 and $200,000 at the first quarter level of sales. Homes priced below $150,000 was only slightly longer at 20 days. All price bands saw a reduction in the months-of-supply.
Months-of-Supply for homes priced above-$350,000 dropped dramatically to 2.9 months-of-supply from the 5.4 months one year ago. The longest months-of-supply for all homes in the decade occurred in 2012 at 8.1 months. SeeFigure 11.
Comparing the number of pending sales for the quarter with the available inventory at the end of the quarter shows the dramatic downward trend in homes available for sale while the number of homes pending sale rises. There were 877 homes listed at the end of the first quarter 2020 while there were 729 home sales pending for a total of 1,606 homes “not sold” in Madison County. If this trend continues, the number of sales will drop due to a lack of available homes.
Figure 12
Figure 13
Sales & Average Inventory Trends
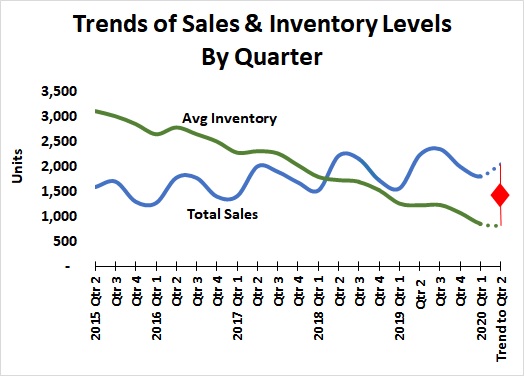
Average inventory of homes available for sale (green line in Figure 14) continues to decline while the number of units sold (blue line) continues to climb. These trends cannot continue indefinitely as inventory falls without upward pressure on prices.
Figure 14 suggests sales volume may continue to rise slightly in the second quarter of 2020 before considering the effects of the shutdown of much of the economy to minimize virus infections. The number of newly constructed homes may increase since construction continues during the economic shutdown.
Note that the current or another shock to the economy may affect the demand for or supply of homes or both.
Real estate activity is subject to many forces including the number of people needing housing, their ability to purchase, and the confidence they have in the stability of their future income. The economic size of the region represented by the area’s Gross Domestic Product (GDP) may also provide insight into the future of the real estate industry.
Figure 14
Madison County Population & Workforce Trends
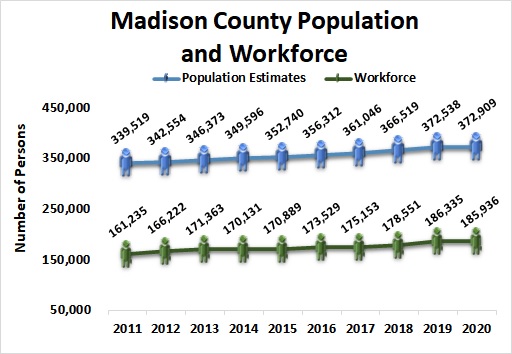
Population of Madison County as estimated by the U.S. Census Bureau has grown steadily since the 2010 census. The population in 2010 was 334,811 persons. The most recent annual estimate of Madison County’s total population shows a 11% increase to 372,909 in 2020 from 2010. See the blue line in Figure 15.
The workforce is comprised of the number of people working and looking for work. The annual workforce (green line) has also risen since 2010 by 15% to reach 185,936 in 2020. Growth in the number of people with jobs likely creates new demand for housing in the region. It is important to note that the workforce is drawn from surrounding counties so not all new members of the workforce will be seeking housing in Madison County.
Figure 15
Figure 16
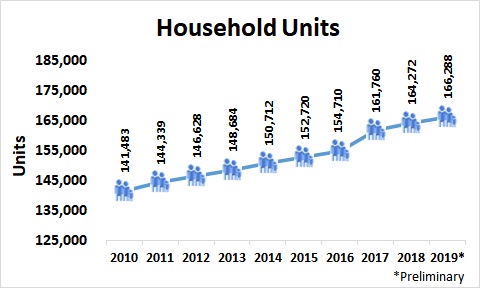
Households
The number of households represents the number of housing units of all types needed in the area — Madison County. Households may be comprised of nuclear families, extended families, individuals living alone as well as housing for unrelated roommates. Housing units should generally move in relation to population but not always at the same rate – there may be lag of time.
The number of housing units in Madison County, Alabama grew from 141,483 in 2010 to an estimated 166,288 in 2019 per the U.S. Census Bureau. This is an increase of 17.5% over the decade. See Figure 16 above.
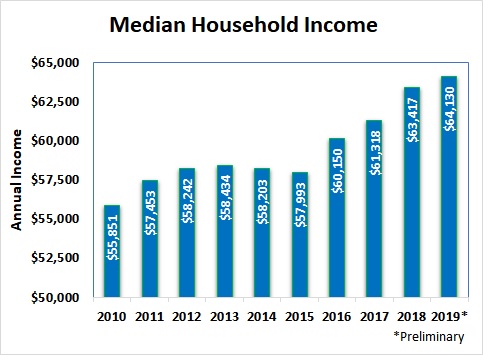
Household Income
The Annual Household Income suggests a level of resources in the region and could be used to estimate housing affordability. The estimated median annual household income for 2019 was $64,130. The Median level represents the point where one-half of the households have income above and one-half have income below the level. Overall, the Annual Median Household Income in current dollars has grown by 14.8% since 2010. See Figure 17.
Figure 17
Figure 18
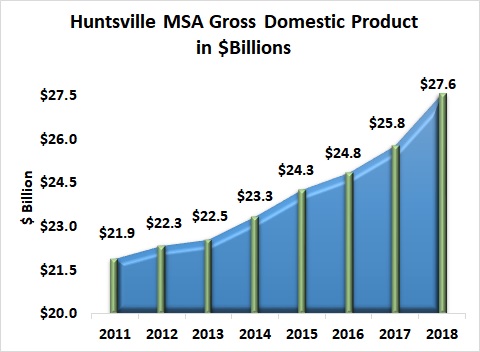
Gross Domestic Product – Huntsville Metropolitan Statistical Area
Gross Domestic Product is the sum of all goods and services produced in the region. The Huntsville Metropolitan Statistical Area is comprised of Limestone and Madison Counties, Alabama.
Gross Domestic Product for the Huntsville MSA grew to approximately $27.6 billion dollars in 2018, the most recent year data is available. This is an increase of 26% since 2011. See Figure 18.
Economic Growth Developments
The Chamber of Commerce of Huntsville/Madison County is the lead economic development organization in Madison County. Existing industry and new industry announcements may provide insight into the economic activity in the coming year. These announcements can be found at this link.