Real Estate Market Ends On High Note in 2019
Posted on 02/05/2020
Posted on 02/05/2020

Sales during the 4th quarter grew by more than 15% compared to the same quarter in 2018, but continued the seasonal pattern for the final quarter of the year. Prices of homes sold continued to rise significantly from 2018. Median sales price rose 11% to $239,643 and average sales price increased 7% to $258,014. The price escalation can be seen in the decline in the number of homes sold in the less-than-$150,000 homes and significant increases in the $200,000-$250,000 (20.5%) and the greater than-$350,000 range (18.5%). Average monthly pending sales rose to 456, up 16.6% from the 2018 4th quarter level. Inventory of homes available for sale fell to the lowest level since 2001 with only 993 homes listed at year’s end. The average days on market for the quarter was 35 days, down from 38 in the 3rd quarter and from 48 in the 4th quarter 2018. At this level of sales, there was an average of only 1.3 months of supply during the quarter. Overall, the 4th quarter residential real estate activity continued the record pace for 2019. The 1,995 homes sold in the quarter resulted in the annual total of 8,150. With only 993 listed homes to start 2020 combined with a growing population and a strong job market, the new year should produce a very interesting challenge for the industry.
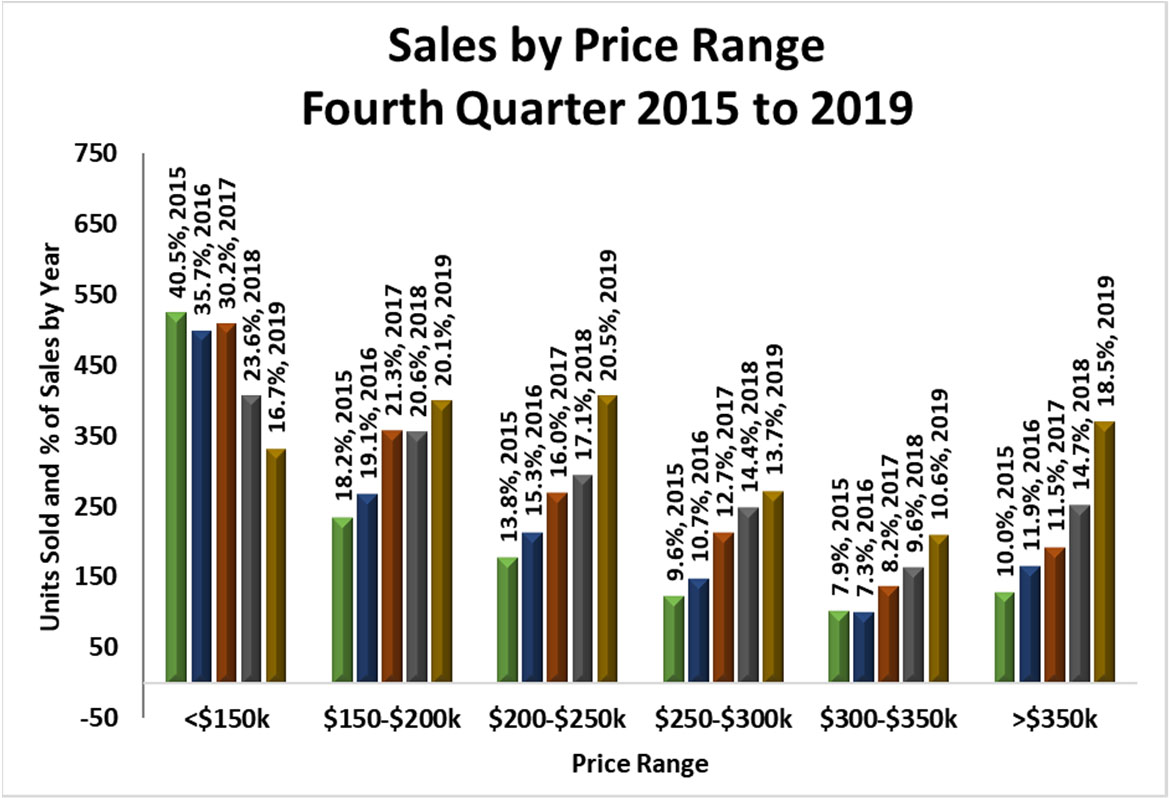
Sales by Price Range – Examining sales by property price range shows an unique perspective of upward movement in sales prices. In the 4th quarter 2019 (gold column), the largest percentage of homes sold were in the $200,000- $250,000 range at 20.5% of all homes sold. The $150,000- $200,000 range was a close second at 20.1%. The smallest share of sales was in the $300,000-$350,000 range at only 10.6% in 2019. The less than-$150,000 range fell Figure 7 from 40.5% of all sales in 2015 to 23.6% in 2018 and to 16.7% in 2019. The $150,000-$200,000 priced homes grew from 18.2% in 2015 to about 20% by 2019. The change in the number of homes sold in each price range was greatest in the above-$350,000 range with an increase of 46.2% for the 4th quarter. The $200,000-$250,000 range jumped by 38.3% from 2018. Fewer homes in the under-$150,000 homes were sold in both 2018 and 2019.
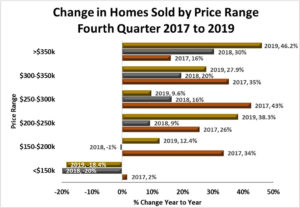
In all, home sales grew in four of six price bands: $150-$200k, $200-$250k, $300-$350k, and above- $350k. The under-$150k group saw significant declines in the number of homes sold in both 2018 and 2019 while the $250-$300k range had the smallest increase in homes sold of 9.6%.
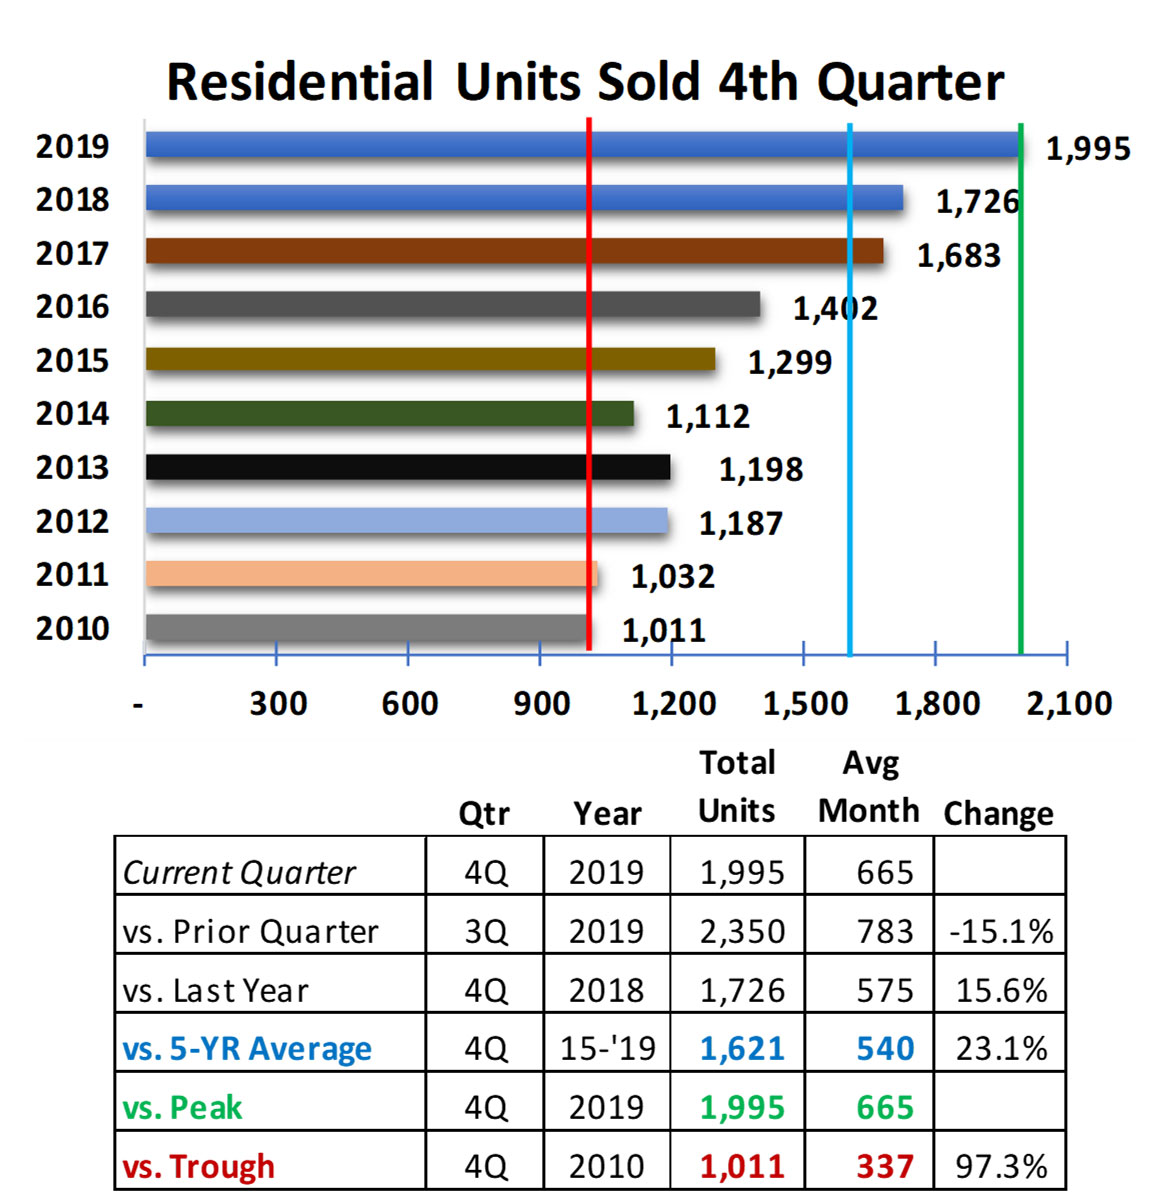
Residential Sales Volume – The vertical green line represents the peak level of 4th quarter sales since 2010. The blue vertical line represents the five-year 4th quarter average number of sales (1,621). The red line represents the lowest number of homes sold (1,011) in a 4th quarter since 2010. Residential home sales had a strong surge in the 4th quarter up 15.5% from 2018 with a total of 1,995 homes sold. However, the seasonality of the 4th quarter resulted in fewer sales than in the 3rd quarter. Compared with the 5-year average of 4th quarter sales, 2019 was higher by 23.1% and almost double (197.3%) of the lowest level of the decade in 2010.
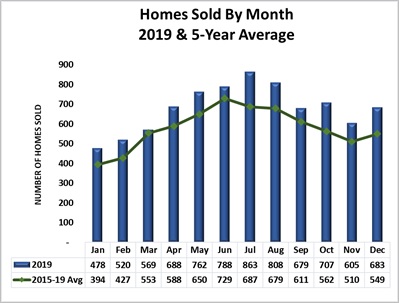
Seasonality of Sales – Monthly sales peaked in July during 2019 (blue columns) while the five-year average monthly sales peaks in June (green column in Figure 10). Sales were higher than the five-year average in every month of the year.
July, August, October, Novem-ber, and December monthly sales were significantly higher in 2019. Only March was close to the five-year average number of sales.
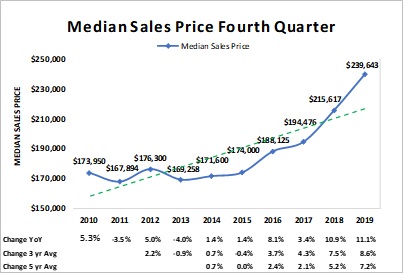
Median Sales Price – The median (midpoint) sales price in Madison County for the 4th quarter of 2019 was $239,643, an increase of 11% from 4th quarter 2018. The five-year average sales price grew by 7% in the past year. The green dotted line in Figure 11 shows the simple trend in median sales price for the decade and highlights the unusual increases in the 4th quarters of 2018 and 2019.
The median sales price continued to rise at a greater than 10% rate for the second year. Home prices are rising at a substantially higher rate than the general inflation rate. The estimated inflation rate for 2019 is 2.1% while the median home price rose 11.1%.
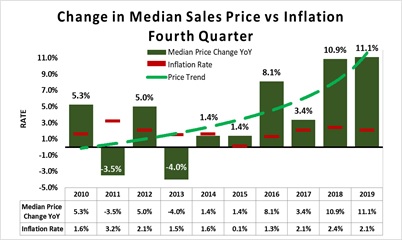
Note that there can be many reasons for changes in median sales prices such as the mix of homes sold as well as the price increases of comparable homes (price inflation). Figure 12 shows the percentage change in the 4th quarter median prices since 2010. The green dotted line represents the overall trend in 4th quarter Median Sales Price.
The national Inflation Rate (red bar) in Figure 12 represents the increase in overall cost of living for each year. In years where the change in Median Sales Price (green column) is higher than the Inflation Rate (red bar), the increase in home prices were greater than the increase in the cost of living. The 10-year average annual inflation rate is approximately 1.8% while the average increase in median sales price for homes for the 10 years is almost 4%, a rate heavily influenced by the double digit increases in prices during the past two years.
Change in the rise in median price versus inflation rate is not a perfect comparison, but it does show that the value of homes in Madison County have risen more than the overall cost of living and may provide insight into the price pressures of demand for supply of houses.
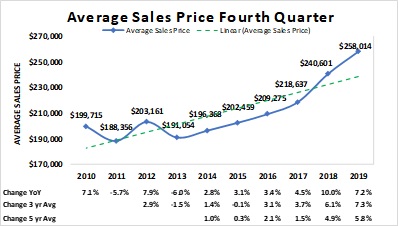
Average Sales Price – The average sales price for all homes sold during the 4th Quarter 2019 rose to $258,014, an increase of 7.2% from the 4th quarter 2018 level of $240,601. The current level is 8.8% above the five-year average sales price. The green dotted line represents the increasing average price trend since 2010.

Days on Market – The average number of days on the market (DOM) in the 4th quarter of 2019 dropped to 35 days from 38 days in 3rd quarter of 2019 and 48 days in the 4th quarter of 2018. The declines are dramatic at 26.4% from 4th quarter 2018 and 18.9% below the five-year average DOM (blue vertical line). Since the peak in 2014 of 124 days (green vertical line), the average time to sell a listed home has dropped each year.

Months of Supply – Months of Supply of listed homes available for sale dropped in all six price bands for the fifth year in a row. Homes with sales prices below $200,000 have the lowest inventory available with inventory at 0.8 months. Homes priced above $350,000 represent 3.1 months of sales at the current sales pace.
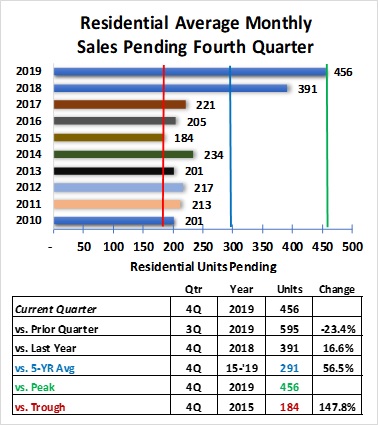
Pending Sales – At the end of the 4th quarter 2019, there were 456 sales pending to be closed compared with 391 pending sales in the final quarter of 2018. Examining 4th quarter levels since 2010, the current 4th quarter level is 16.6% higher than 2018, 56.5% higher than the 5-year average (blue vertical line), and 147.8% higher than the lowest number in 2015 (red vertical line). However, there was a 23.4% reduction in the number of pending sales from the 3rd quarter 2019. See Figure 16.

Homes for Sale – The average number of residential units available for sale in the 4th Quarter of 2019 decreased to 1,063, the lowest level since 2010. The drop from the 3rd quarter totaled 161 fewer listed homes. Since 2014, the inventory of listed homes has dropped at a fairly steady rate. See Figure 17.
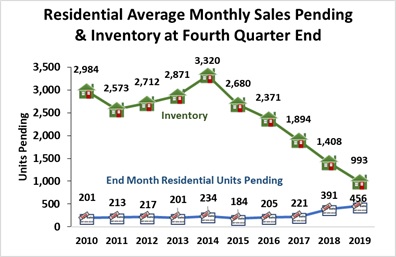
Figure 18 compares the inventory of listed homes with the pending sales annually since 2010. Inventory has been dropping much faster than the pending sales has risen suggesting that the real estate closing services and financing options are generally keeping pace with the market demand.
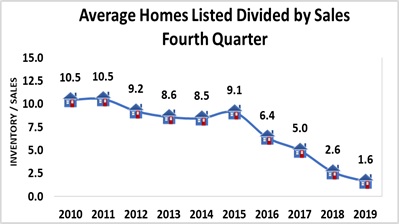
Inventory-to-Sales Ratio – The quarterly average number of homes listed for sale (inventory) divided by the current quarterly average sales results in a metric of 1.6 houses available for sale for each house sold in the 4th quarter. This is 15% of the level observed in 2010 and 2011 and less than half of the level only three years ago in 2017. See Figure 19
Real estate activity is subject to many forces including the number of people needing housing, their ability to purchase, and the confidence they have in the stability of their future income. The economic size of the region represented by the area’s Gross Domestic Product (GDP) may also provide insight into the future of the real estate industry.
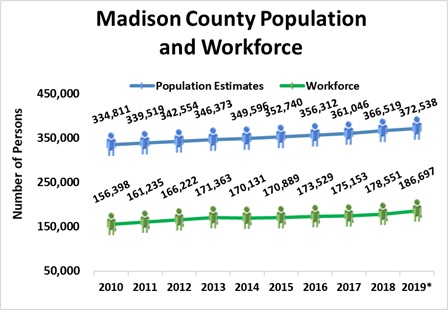
Madison County Population & Workforce Trends – Population of Madison County as estimated by the U.S. Census Bureau has grown steadily since the 2010 census. The population in 2010 was 334,811 persons. The most recent annual estimate of Madison County’s total population shows a 11.2% increase to 372,538 in 2019 from 2010. See the blue line in Figure 20.
The workforce is comprised of the number of people working and looking for work. The annual workforce (green line) has also risen since 2010 by 19% to reach 186,697 in 2019. Growth in the number of people with jobs likely creates new demand for housing in the region. It’s important to note that the workforce is drawn from surrounding counties so not all of the new members of the workforce will be seeking housing in Madison County.
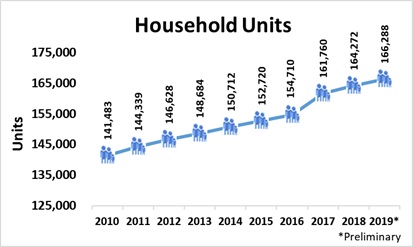
Households – The number of households represents the number of housing units of all types needed in the area— Madison County. Households may be comprised of nuclear families, extended families, individuals living alone as well as housing for unrelated roommates. Housing units should generally move in relation to population but not always at the same rate – there may be lag.
The number of housing units in Madison County, Alabama grew from 141,483 in 2010 to an estimated 166,288 in 2019 per the U.S. Census Bureau. This is an increase of 17.5% over the decade. See Figure 21.
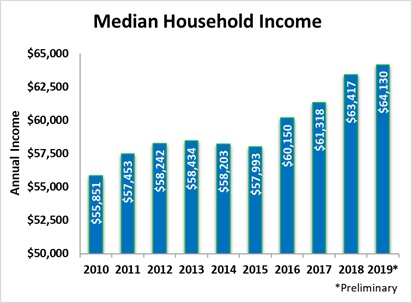
Average Household Income – The Annual Household Income suggests a level of resources in the region and could be used to estimate housing affordability. The estimated median annual household income for 2019 was $64,130. The Median level represents the point where one-half of the households have income above and one-half have income below the level. Overall, the Annual Median Household Income in current dollars has grown by 14.8% since 2010. See Figure 22.
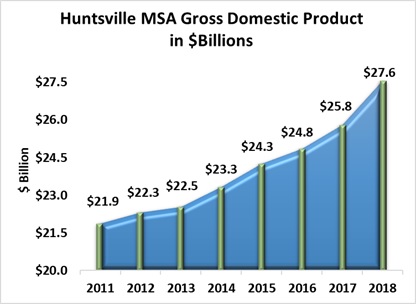
Gross Domestic Product, Huntsville Metropolitan Statistical Area – Gross Domestic Product is the sum of all goods and services produced in the region. The Huntsville Metropolitan Statistical Area is comprised of Limestone and Madison Counties, Alabama.
Gross Domestic Product for the Huntsville MSA has grown to approximately $27.6 billion dollars in 2018, the most recent year data is available. This is an increase of 26% since 2011. See Figure 23.
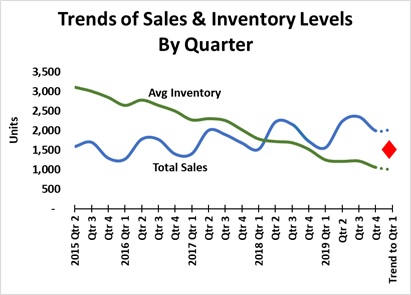
Sales & Average Inventory Trends – If average inventory of homes available for sale (green line) continues its downward trend and the number of units sold (blue line) continues its upward trend, there will be upward pressure on prices.
Figure 24 suggests that sales volume may remain flat or rise slightly in the 1st quarter of 2020. Inventory will likely continue to decline until newly constructed homes become available. Note that a shock to the economy could occur on any given day and could affect the demand for or supply of homes or both.
Data Sources:
Analysis & Report Prepared By: