


CLICK HERE to download our latest economic report as a PDF
As the Huntsville real estate market experiences increased sales and a greater demand for homes, concerns about housing affordability at all price points naturally arises. Even though housing prices have steadily increased over the past few years, sales continue to remain steady. Despite the unusual circumstance of increasing prices failing to dampen sales, Realtors and prospective homebuyers alike should watch these trends closely in the coming months.
A housing affordability measure evaluates the ability of an average buyer to make monthly payments on a property with a given mortgage rate, income and housing price. The higher the affordability measure, the more affordable a respective location is. A lower measure means that houses are less affordable in the area. This report analyzes the Huntsville Metropolitan Statistical Area (MSA)’s housing affordability index over time and compares it with 16 similar MSAs across the country.
Mortgage rate, income and price are all closely tied to affordability. An increase in income or a decrease in mortgage rates and housing prices lead to a higher affordability rate. Areas with lower income rates or higher than average mortgage rates or housing prices will reflect a lower affordability rate.
|
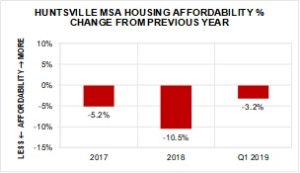
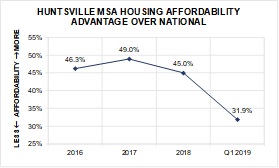
Figure 1 |
|
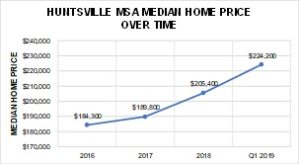
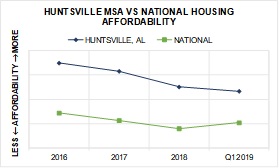
Figure 2 |
|
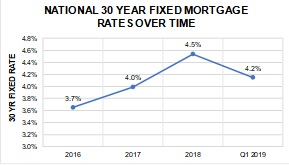
Figure 3 |
|
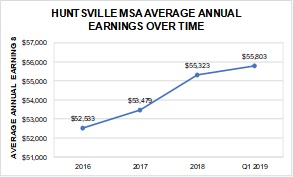
Figure 4 |
These three variables change over time and are not necessarily tied to each other. As a result, affordability may not be perfectly measured across multiple years. Instead, a better picture of an area’s affordability can be found by tracking each variable’s movement on their own.
When looking at Huntsville, interest rates the past few years have steadily increased along with annual earnings and home prices. However, the magnitude of these increases is more pronounced with home prices. Since home prices are the main driver of affordability, Huntsville has experienced a declining affordability over the past few years. See Figures 1-4.
However, when analyzing how Huntsville compares to the nation, Huntsville has a major affordability advantage. Despite seeing home prices creep up and sales at an all-time high, Huntsville still boasts a 31.9% housing affordability advantage for 2019. This is a testament to the continuous growth of higher-paying jobs in the Tennessee Valley. See Figures 5 & 6.
|
Figure 5 |
|
Figure 6 |
On top of comparing Huntsville nationally, there were 16 additional MSAs analyzed for their affordability. They were chosen because of their shared characteristics with Huntsville or because people in those MSAs commonly relocate to Huntsville. For instance, Raleigh, North Carolina was chosen because it has a research-based economy comparable to Huntsville. Washington, DC was selected because of the close relationships with the U.S. Army, NASA, FBI, and other Redstone Arsenal entities. These MSAs are organized by region and offer a quick snapshot of how Huntsville compares across the nation.
Comparison with Regions of U.S.
|
Figure 7 |
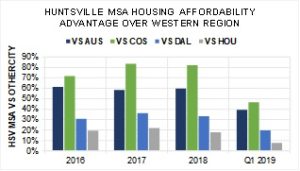
In the Western Region, Huntsville’s MSA has a sizable advantage over various cities. This year, there is a 39.5% affordability advantage over Austin, TX MSA (AUS), 46.8% affordability advantage over Colorado Springs, CO MSA (COS), 19.8% affordability advantage over Dallas, TX MSA (DAL), and a 7.8% affordability advantage over Houston, TX MSA (HOU). See Figure 7.
|
Figure 8 |
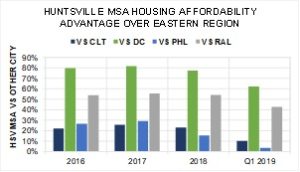
In the Eastern Region, Huntsville again looks significantly favorable. The greatest housing affordability advantage is over the Washington D.C. MSA (DC) with an affordability edge of 62.2%. That is followed by Raleigh, NC MSA (RAL) with Huntsville being 42.6% more affordable. In addition, Huntsville maintains an upper hand over Charlotte, NC MSA (CLT) being 10.1% more affordable and Philadelphia, PA MSA (PHL) with a 3.4% advantage. See Figure 8.
|
Figure 9 |
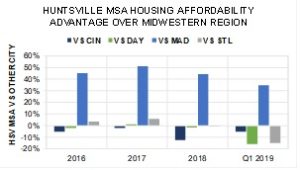
Looking at the Midwestern Region, Huntsville’s affordability is less of an advantage. In fact over the past couple years, the affordability of Huntsville is slightly below that of Cincinati, OH MSA (CIN) -5.2%, Dayton, OH MSA (DAY) -15.9%), and St. Louis, MO MSA (STL) -15.1%). On the other hand, compared to Madison, WI MSA (MAD), Huntsville still has more than a 30% affordability advantage. See Figure 9.
|
Figure 10 |
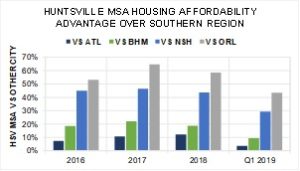
The final region analyzed was the Southeastern Region, and Huntsville looks strong among its neighboring cities. Huntsville is more affordable than all the areas that were analyzed in the Southeast Region. It is 3.7% more affordable than Atlanta, GA MSA (ATL), 9.4% above Birmingham, AL MSA (BHM), 29.3% over Nashville, TN MSA (NSH), and 43.6% above Orlando, FL MSA (ORL) in 2019. See Figure 10.
Affordability & Mortage Rates
There have been a lot of questions regarding affordability if mortgage rates increase, the analysis below shows how affordability would change as mortgage rates change. Table 1 shows all the MSAs and their respective affordability measure holding income and home prices constant at their 2019 levels. The data in the table have no intrinsic meaning but can serve as a relative comparison highlighting different areas or various rates. The highlighted column showcases the average mortgage rate for August 2019.
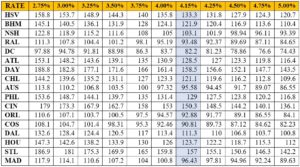
Table 1
A better visualization of the numbers in Table 1 can be found in Figure 11. This graph demonstrates the different affordability levels at varying interest rates for major cities in the Southeast. Once again, 4.15% is marked with a data label of current as the national 30-year mortgage rate in August 2019.
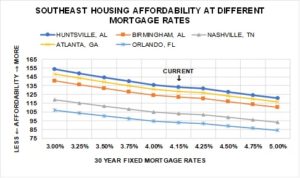
Figure 11
Conclusion:
Affordability is a relative concept based on the resources available and costs. Housing affordability is usually defined as a function of monthly income, annual mortgage rate (monthly principle + interest), and the median price of a home. Housing affordability is shown relative to the national “average” and other similar regions of the U.S. This comparison suggests that the Huntsville MSA (Madison & Limestone counties) has a significant affordability advantage over many locations with similar or at least related economies. Note that this analysis does not and should not be used to estimate how much home prices or mortgage rates could rise and still be deemed “affordable”. This analysis does demonstrate that today’s cost of single-family homes in Madison and Limestone Counties are generally below the costs in other, comparable regions of the U.S.
Data Sources:
- National Association of Realtors – Median Home Prices
- Bureau of Labor and Statistics – Average Annual Earnings
- Fannie & Freddie Mac – 30 Year Fixed Mortgage Rates
Analysis & Report Prepared By:
- Madeline Glosemeyer, Principle Researcher
- Jeff Thompson, Research Advisor
- Brinda Mahalingam, PhD., Project Advisor
Questions Regarding This Report Should Be Directed To:
- Jeff Thompson, jeffthompson@uah.edu, 256.361.9065
APPENDIX – Metropolitan Statistical Areas Defined:
ATL – CBSA Code: 12060 – Atlanta-Sandy Springs-Marietta, GA Metropolitan Statistical Area Includes:
- Barrow County, GA; Bartow County, GA; Butts County, GA; Carroll County, GA; Cherokee County, GA; Clayton County, GA; Cobb County, GA; Coweta County, GA; Dawson County, GA; DeKalb County, GA; Douglas County, GA; Fayette County, GA; Forsyth County, GA; Fulton County, GA; Gwinnett County, GA; Haralson County, GA; Heard County, GA; Henry County, GA; Jasper County, GA; Lamar County, GA; Meriwether County, GA; Newton County, GA; Paulding County, GA; Pickens County, GA; Pike County, GA; Rockdale County, GA; Spalding County, GA; Walton County, GA
AUS – CBSA Code: 12420 – Austin-Round Rock-San Marcos, TX Metropolitan Statistical Area Includes:
- Bastrop County, TX; Caldwell County, TX; Hays County, TX; Travis County, TX; Williamson County, TX
BHM – CBSA Code: 13820 – Birmingham-Hoover, AL Metropolitan Statistical Area Includes:
- Bibb County, AL; Blount County, AL; Chilton County, AL; Jefferson County, AL; St. Clair County, AL; Shelby County, AL; Walker County, AL
CHL – CBSA Code: 16740 – Charlotte-Concord-Gastonia, NC-SC Metropolitan Statistical Area Includes:
- Anson County, NC; Cabarrus County, NC; Gaston County, NC; Mecklenburg County, NC; Union County, NC; York County, SC
CIN – CBSA Code: 17140 – Cincinnati-Middletown, OH-KY-IN Metropolitan Statistical Area Includes:
- Dearborn County, IN; Franklin County, IN; Ohio County, IN; Boone County, KY; Bracken County, KY; Campbell County, KY; Gallatin County, KY; Grant County, KY; Kenton County, KY; Pendleton County, KY; Brown County, OH; Butler County, OH; Clermont County, OH; Hamilton County, OH; Warren County, OH
COS – CBSA Code: 17820 – Colorado Springs, CO Metropolitan Statistical Area Includes:
- El Paso County, CO; Teller County, CO
DAL – CBSA Code: 19100 – Dallas-Fort Worth-Arlington, TX Metropolitan Statistical Area Includes:
- Collin County, Dallas County, Denton County, Ellis County, Hood County, Hunt County, Johnson County, Kaufman County, Parker County, Rockwall County, Somervell County, Tarrant County, and Wise County.
DAY – CBSA Code: 19380 – Dayton, OH Metropolitan Statistical Area Includes:
- Greene County, OH; Miami County, OH; Montgomery County, OH; Preble County, OH
DC – CBSA Code: 47900 – Washington-Arlington-Alexandria, DC-VA-MD-WV Metropolitan Statistical Area Includes:
- District of Columbia, DC; Calvert County, MD; Charles County, MD; Frederick County, MD; Montgomery County, MD; Prince George’s County, MD; Arlington County, VA; Clarke County, VA; Fairfax County, VA; Fauquier County, VA; Loudoun County, VA; Prince William County, VA; Spotsylvania County, VA; Stafford County, VA; Warren County, VA; Alexandria city, VA; Fairfax city, VA; Falls Church city, VA; Fredericksburg city, VA; Manassas city, VA; Manassas Park city, VA; Jefferson County, WV
HOU – CBSA Code: 26420 – Houston-The Woodlands-Sugar Land, TX Metropolitan Statistical Area Includes:
- Austin County, TX; Brazoria County, TX; Chambers County, TX; Fort Bend County, TX; Galveston County, TX; Harris County, TX; Liberty County, TX; Montgomery County, TX; San Jacinto County, TX; Waller County, TX
HSV – CBSA Code: 26620 – Huntsville, AL Metropolitan Statistical Area Includes:
- Limestone County, AL; Madison County, AL
MAD – CBSA Code: 31540 – Madison, WI Metropolitan Statistical Area Includes:
- Columbia County, WI; Dane County, WI; Iowa County, WI
NSH – CBSA Code: 34980 – Nashville-Davidson-Murfreesboro-Franklin, TN Metropolitan Statistical Area Includes:
- Cannon County, TN; Cheatham County, TN; Davidson County, TN; Dickson County, TN; Hickman County, TN; Macon County, TN; Robertson County, TN; Rutherford County, TN; Smith County, TN; Sumner County, TN; Trousdale County, TN; Williamson County, TN; Wilson County, TN
ORL – CBSA Code: 36740 – Orlando-Kissimmee-Sanford, FL Metropolitan Statistical Area Includes:
- Lake County, FL; Orange County, FL; Osceola County, FL; Seminole County, FL
PHL – CBSA Code: 37980 – Philadelphia-Camden-Wilmington, PA-NJ-DE-MD Metropolitan Statistical Area Includes:
- New Castle County, DE; Cecil County, MD; Burlington County, NJ; Camden County, NJ; Gloucester County, NJ; Salem County, NJ; Bucks County, PA; Chester County, PA; Delaware County, PA; Montgomery County, PA; Philadelphia County, PA
RAL – CBSA Code: 39580 – Raleigh-Cary, NC Metropolitan Statistical Area Includes:
- Franklin County, NC; Johnston County, NC; Wake County, NC
STL – CBSA Code: 41180 – St. Louis, MO-IL Metropolitan Statistical Area Includes:
Bond County, IL; Calhoun County, IL; Clinton County, IL; Jersey County, IL; Macoupin County, IL; Madison County, IL; Monroe County, IL; St. Clair County, IL; Franklin County, MO; Jefferson County, MO; Lincoln County, MO; St. Charles County, MO; St. Louis County, MO; Warren County, MO; Washington County, MO; St. Louis city, MO