


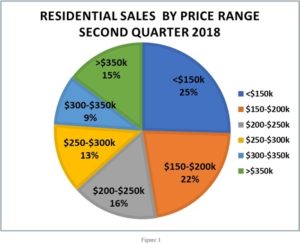
Madison County continues to see record levels of home sales. During the 2nd Quarter of 2018, homes priced below $150,000 comprised 25% of the home sales during the quarter. Average and Median Sales Prices continued their rise to historic levels, while the number of homes listed for sale dropped to a new recorded low. Demand for housing in the Huntsville Area remains strong with the growing population, workforce, income, and Gross Domestic Product. It is reasonable to expect that the market momentum will continue into the 3rd Quarter of 2018 and maybe further barring any major economic surprises. The level of demand for homes appears to be enticing more homeowners to list their house for sale and beginning to encourage builders to increase construction of new homes in the Madison County area.
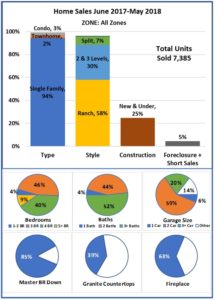
Our task force made up of Realtors® charged our research team to find out how home features drive home sales in school zones around our county. The findings suggest that the “Ideal” home in Madison County between June 2017 and May 2018 was a 3-bedroom, 3-bath single-family ranch style home with a downstairs master bedroom, non-granite countertops, a fireplace, and a 2-car garage. More features and school zone data are included in the full report.
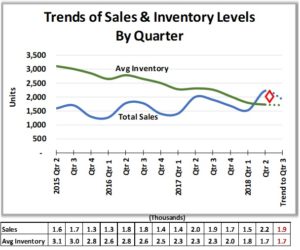
The trends analysis for Quarter 2 shows that If the average inventory of homes available for sale continues its downward trend and if the number of units sold also continues its upward trend, there will be continued increase in home sales prices.
You can read the full report below or download it HERE.
Second Quarter Recap
Record levels of home sales continue. During the 2nd Quarter of 2018, homes priced below $150,000 comprised 25% of the home sales during the quarter. Figure 1 shows the percentage of sales in each of six price bands.
Average and Median Sales Prices continued their rise to new levels while the number of homes listed for sale dropped to a new low.
Demand for housing remains strong with the growing population, workforce, income, and Gross Domestic Product. It is reasonable to expect that the market momentum will continue into the 3rd Quarter and maybe further barring any major economic surprises. The level of demand for homes appears to be enticing more homeowners to list their house for sale and beginning to encourage builders to increase construction of new homes in the Madison County area.
Fair Housing Act 50th Anniversary
This quarter’s Huntsville Area Real Estate Economics Report breaks down the current factors that helps homes sell in the Huntsville Alabama market. Important to consider is the relevance of a report like this during this year. 50 years ago, Congress passed the Civil Rights Act of 1968 better known as the “Fair Housing Act” providing equal access to housing opportunities. The act has been amended twice since then to include protections for housing afforded to Americans regardless of race, color, national origin, religion, sex, familial status, and disability. The National Association of REALTORS® has produced a research paper as a deep dive on access to housing opportunities. REALTORS® adhere to a strict code of ethics that helps to underline the “Fair Housing Act” but goes even further to also say that we would extend this practice regardless of all the factors included in the national fair housing act plus handicap, sexual orientation and gender identity. Fair housing benefits us all by building stronger, diverse, inclusive communities that improve the quality of life for all that live there.
Josh McFall, Huntsville Area Association of REALTORS ® Chief Executive Officer
Report Content
I. Real Estate Analysis Focus
II. Sales & Price Levels
III. Market Momentum
IV. Inventory Status
V. Demographics
VI. Local Area Outlook
VII. Other Economic Insight
VIII. Data Sources
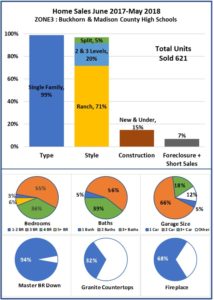
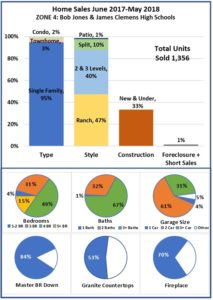
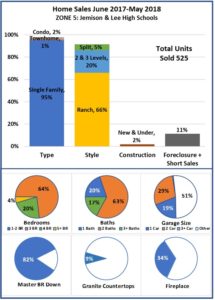
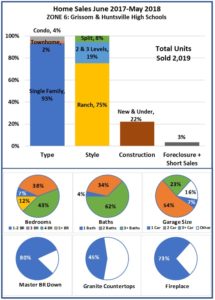
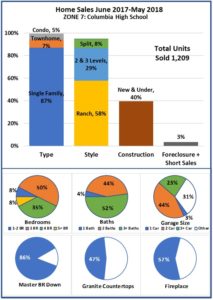
- Real Estate Analysis Focus: Home Features
There are many reasons buyers select one home over others in the same price range such as neighborhood, age, location, etc. Preference for homes with specific features may suggest attractiveness based on style, size, and number of levels. Ten features of homes sold in Madison County, Alabama between June 1, 2017 and May 31, 2018 are analyzed and shown for eight geographic areas generally aligned with high school zones.
The ten features shown include the number of bedrooms, number of bathrooms, master bedroom level, garage size, countertops, and fireplace. Additionally, the type of home (single family, condominium, townhome), style of home (ranch, 2-3 levels, split-level), and new/under construction, and foreclosure/short-sale purchases are shown.
The analysis includes overall Madison County plus eight zones. The zones represented by one or more high school districts are:
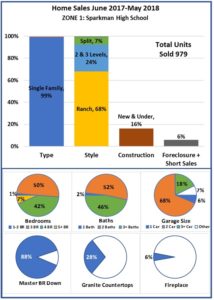
- Zone 1 – Sparkman High School (Northwest)
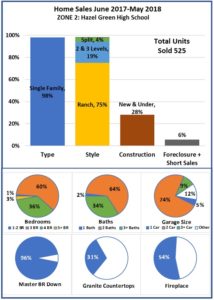
- Zone 2 – Hazel Green High School (North)
- Zone 3 – Buckhorn High School and Madison County High School (Northeast)
- Zone 4 – Bob Jones High School and James Clemens High School (West)
- Zone 5 – Jemison High School and Lee High School (North and East)
- Zone 6 – Grissom High School and Huntsville High School (Central and Southwest)
- Zone 7 – Columbia High School (Central and West)
- Zone 8 – New Hope High School (Southeast)
The top chart shows the percentage of homes sold in this period by type of home, the style of home, new/under construction homes, and homes in foreclosure or short sale situation. The total number of homes sold is shown with each group of charts.
The pie charts show the percentage of homes sold during this 12-month period by number of bedrooms, baths, garage size, master bedroom level, presence of granite countertops, and presence of at least one fireplace.
This analysis suggests that the “ideal” home in Madison County between June 2017 and May 2018 was a 3-bedroom, 3-bath single-family ranch style home with a downstairs master bedroom, non-granite countertops, a fireplace, and a 2-car garage. One-fourth of the homes sold were newly constructed or under construction at the time of sale. See Figure 2.
Real Estate Analysis Focus: Home Features
Madison County Overall Summary
| Madison County
Overall Summary |
Zone 1 | |
 |
 |
|
| Zone 2 | Zone 3 | |
 |
 |
|
| Zone 4 | Zone 5 | |
 |
 |
|
| Zone 6 | Zone 7 | |
 |
 |
|
| Zone 8 | ||
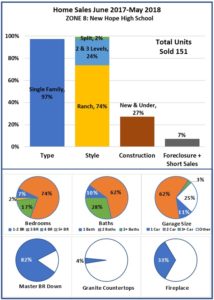 Zone 8 |
||
II. Sales & Price Levels
Residential Sales
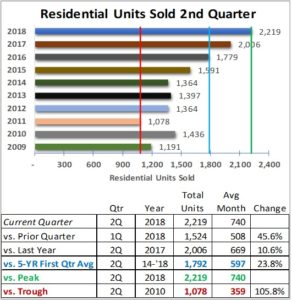
Residential home sales growth continued in the 2nd Quarter with 2,219 homes sold to reach a new peak level. The 2018 sales level was 10.6% higher than 2nd Quarter 2017. Total sales were 45.6% higher than the 1st quarter of 2018. The sales grew by 23.8% above the five-year average of 2nd quarter sales.
The vertical green line represents the peak level of sales between 2009 and 2018 for the 2nd quarter. The blue vertical line represents the five-year 2nd quarter average number of sales. The red line represents the lowest number of homes sold. See Figure 11.
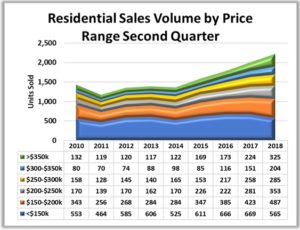
Sales Volume by Price Range
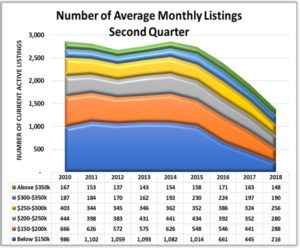
Homes with sale prices below $150,000 continue to comprise the largest share (25%) of total sales but saw a decline of 104 units from the level in the 1st Quarter 2018.
The largest percentage increase in sales was in the over $350,000 price range at 45% growth from the 2nd quarter 2017. Homes priced between $300,000 -$350,000 grew by 35% quarter over quarter. Figure 12.
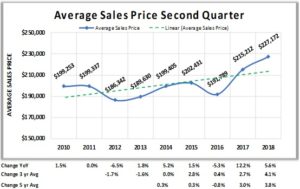
Average Sales Prices
The average sales price for all homes sold during the 2nd Quarter 2018 was $227,172, a 5.6% increase from the 2017 2nd Quarter average selling price of $215,212. See Figure 13.
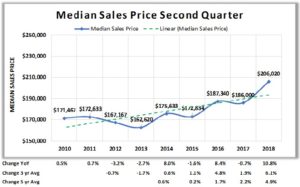
Median Sales Price
The median (midpoint) sales price in Madison County for the 2nd quarter of 2018 reached $206,020 a 10.8% increase from the 2nd quarter 2017. The five-year average sales price grew by 4.9% in the past year. See Figure 14.
III. Market Momentum
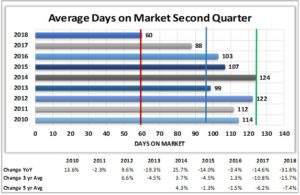
Days on Market
The average number of days on the market (DOM) in the 2nd Quarter of 2018 dropped to 60 days, the lowest DOM (red line) since 2010. This is a drop of 31.8% from 2017. The greatest DOM 2nd Quarter level was reached in 2014 (green line) at 124 days with the five-year average DOM at 96 days (blue vertical line). See Figure 15.
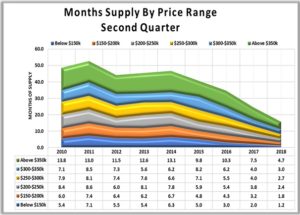
Months of Supply
Months of Supply of homes available for sale dropped in all six price bands. Homes with sales prices below $150,000 has the lowest available inventory at 1.2 months. Homes priced above $350,000 represent 4.7 months of sales at the 2nd Quarter level of sales. See Figure 16.
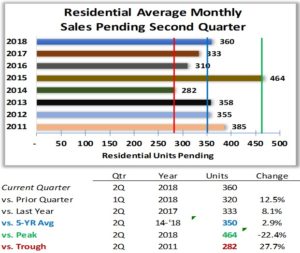
Pending Sales
At the end of the 2nd Quarter 2018 there were 360 sales pending to be closed, an increase of 8.1% from the end of the 2nd Quarter 2017. The largest number of sales pending since 2011 was in 2015 at 464 (green vertical line).
The lowest level (red vertical line) of sales pending occurred in 2014 with 282 sales pending. The five-year average number of sales pending (blue vertical line) for 2014-2018 2nd Quarter was 350 units. See Figure 17.
IV. Homes for Sale Inventory Status
Homes for Sale
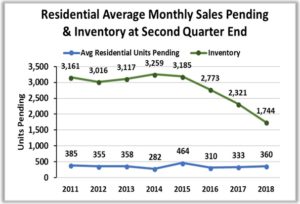
The average number of residential units available for sale in the 2nd Quarter of 2018 decreased to 1,7222. The inventory of homes for sale continues to decline. See Figure 18.
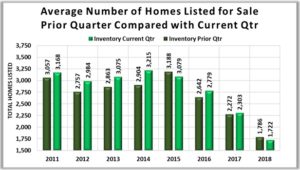
The number of homes listed for sale (green line) at June 30, 2018 dropped from the previous March 31, 2018 level as well as the end of each 2nd Quarter of each year since 2014. The number of sales pending (blue line) has remained fairly steady since 2011. Figure 19.
The greatest decrease in the monthly average number of homes listed for sale this quarter from the 2nd Quarter 2017 was in homes with a sales price below $150,000 (51% or a drop of 229 homes) from the 2nd Quarter 2017. See Figure 20.
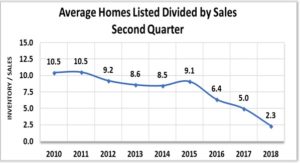
Inventory-to-Sales Ratio
The quarterly average number of homes listed for sale (inventory) divided by the current quarterly average sales results in a metric of 2.3 houses available for sale for each house sold in the 2nd Quarter. This is about 1/5th of the level in 2010. See Figure 21.
V. Key Demographics
Real estate activity is subject to many forces including the number of people needing housing, their ability to purchase, and the confidence they have in the stability of their future income. The economic strength of the region represented by the area’s Gross Domestic Product (GDP) may also provide insight into the future of the real estate industry.
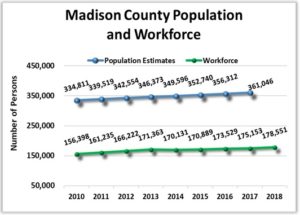
Madison County Population & Workforce Trends
Population of Madison County as counted by the U.S. Census Bureau has grown steadily since the 2010 census. The population in 2010 was 334,811 persons. The most recent annual estimate of Madison County’s total population shows a 7.8% increase to 361,046 in 2017 from 2010. See the blue line in Figure 22.
The workforce is comprised of the number of people working and looking for work. The annual workforce (green line) has also risen since 2010 by 14.1% to reach 178,551 in 2018.
Households
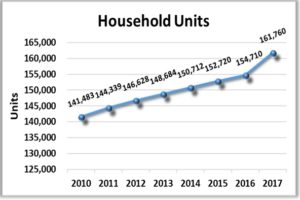
The number of households represents the number of housing units of all types needed in the area, Madison County. Households may be comprised of nuclear families, extended families, individuals living alone as well as housing for unrelated roommates. Housing units should generally move in relation to population but not always at the same rate – there may be lag.
The number of housing units in Madison County, Alabama grew from 141,483 in 2010 to an estimated 161,760 in 2017 (the most recent year data is available) per the U.S. Census Bureau. This is an increase of 14.3% over the seven-year period. See Figure 23.
Average Household Income
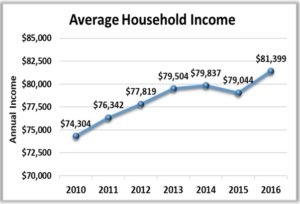
The Average Household Income suggests an income level in the region that could be used to estimate housing affordability.
Overall, the Annual Average Household Income in current dollars has grown significantly (9.5%) since 2010. A slight drop in 2015 more than recovered to $81,399 in 2016 (the most recent year data is available). See Figure 24.
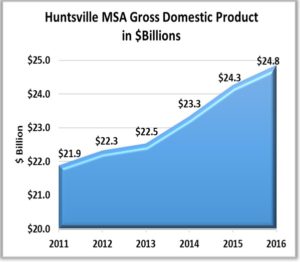
Gross Domestic Product – Huntsville Metropolitan Statistical Area
Gross Domestic Product is the sum of all goods and services produced in the region. The Huntsville Metropolitan Statistical Area is comprised of Limestone and Madison Counties, Alabama.
Gross Domestic Product for the Huntsville MSA grew by 13.2% from 2011. Gross Domestic Product reached $24.8 billion dollars in 2016 (the most recent year data is available) which is a growth of 2.1% from 2015. See Figure 25.
VI. Local Area Outlook
Sales & Average Inventory Trends
If average inventory of homes available for sale (green line) continues its downward trend and if the number of units sold (blue line) also continues its upward trend, there will be upward pressure on prices.
The red diamond on Figure 26 suggests a point during the 3rd Quarter where real estate sales could be noticeably affected by a declining inventory. Note that a shock to the economy could occur on any given day and would affect demand for or supply of homes or both. A simple growth trend calculation (dotted line) suggests that sales could reach 1,900 units on inventory of 1,700 if all conditions theoretically remain constant.
VII. Other Economic Insight
Madison County Job Announcements
Economic development announcements of new and expanding industry are the result of the local community working to grow the economy. It should be noted that the number of jobs announced may be realized over several years while the new or expanded plant is built and employees are hired. The economic development announcements for 2017 and the first six months of 2018 in Madison County are shown below.
Job Announcements 2017

2018 Announcements thru June

VIII. Data Sources
- Alabama Department of Labor
- Chamber of Commerce of Huntsville/Madison County
- Huntsville Area Association of Realtors Quarterly Reports
- S. Bureau of Economic Analysis
- S. Census Bureau
- Valley MLS System
Analysis & Report Prepared by:
Brinda Mahalingam, Ph.D., Economist
Jeff Thompson, Project Director
Madeline Glosemeyer, Student Research Assistant
College of Business, University of Alabama in Huntsville, www.uah.edu/business
Questions regarding this report should be directed to: Jeff Thompson, jeff.thompson@uah.edu, 256.361.9065
Click HERE to download the Huntsville Area Real Estate Economics Report – Second Quarter