Madison County + National Residential Real Estate Market Comparison
Posted on 12/18/2019
Posted on 12/18/2019

MADISON COUNTY – Today, the Huntsville Area Association of REALTORS® (HAAR), in partnership with the UAH College of Business, publicly released its latest real estate economics report, which compares the local housing market in Madison County to its national counterpart. The study finds that locally, Madison County continues to outpace the national residential real estate market.
“Huntsville and Madison County appear on so many Top 10 lists for several good reasons: great job opportunities, low cost of living, a diverse economy and entertainment culture, and responsible management by our elected officials,” said HAAR President Cindi Peters-Tanner. “As a result, our real estate market has out-performed national trends and it continues to be the best place in the nation to buy or sell a home.”
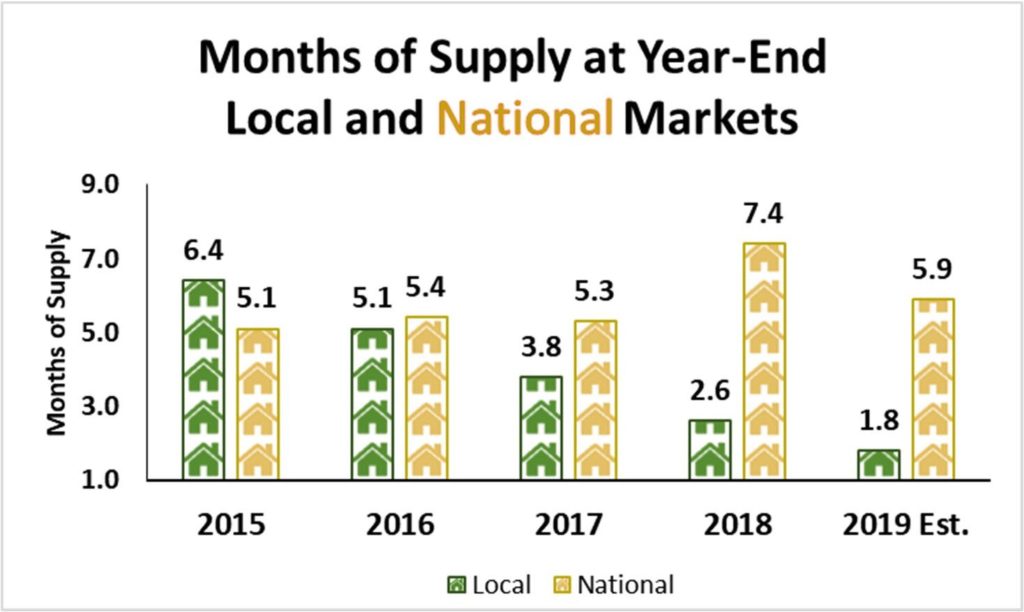
As a result of the local market’s success, inventory remains a concern. Madison County held 6.4 months of housing supply at the end of 2015. Since then, that number has dropped to 1.8 months. Nationally, that figure has risen from 5.1 months to 5.9 months. The report concludes that local new construction will need to grow considerably to meet future demand.
Additional findings of the HAAR / UAH report include:
HAAR has partnered with the UAH College of Business to produce quarterly real estate economic reports to provide Realtors, their clients, public officials, community stakeholders, and the general public an up-to-date snapshot on the local housing market. This critical information helps our community anticipate positive or negative changes as we look ahead to new growth and the challenges it brings.
A PDF copy of the report below can be viewed and printed here. HAAR also recently released a special study, the Huntsville Housing Affordability Report, which can be accessed here.
All of HAAR’s Real Estate Economic Reports are archived at the association’s website, HAAR.realtor.
Overall Comparison
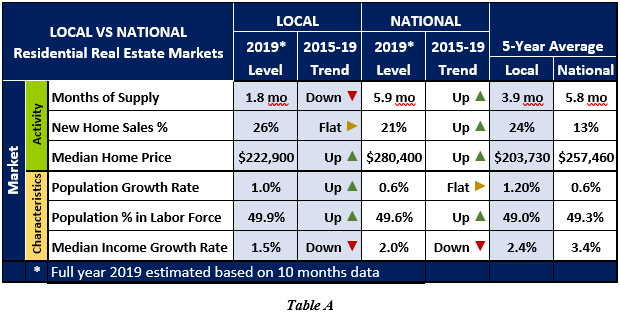
The local Madison County, Alabama residential real estate market remains stronger than the overall national market based on the details of market activity and market characteristics. However, performance over last 5 years shows a reduction of that advantage. Three measures were selected to reflect market activity. Of the three market activity measures (Months of Supply, New Home Sales, and Median Price), two are rising locally while all three are rising nationally. Three market characteristics metrics (Population Growth, Population in Labor Force, and Median Household Income) are shown to represent current and potential growth in demand for homes. These market indicators show similarities between the overall national trends and with the very dynamic local market.
Since 2015, the Madison County residential real estate market has led the national average in (1) New Home Sales Percentage, and (2) Population Growth Rate. Nationally, the Months of Supply of listed homes has remained relatively steady while population in the labor force and median household income has risen slightly. However, when considering the rate of growth, the local population and median household income has slowed while population in the labor force has risen. Nationally, population growth rate has been steady. Table A below shows a comparison of key metrics for the local and the national residential real estate markets.
Months of Supply
Months of Supply of listed homes continues to fall locally and has risen only slightly at the national level. This metric provides insight into the level of inventory of homes available for sale and the current demand for residential real estate. Examining the months of supply at year-end shows the number of listed homes available for sale has dropped each year from 6.4 months in 2015 to 1.8 months in 2019. Nationally, the months of supply has risen from 5.1 months in 2015 to 5.9 months in 2019 peaking in 2018 at 7.4 months. See Figure 1. Note 2019 amounts are estimated based on 10 months of data.
Sales of Existing versus New Construction Homes
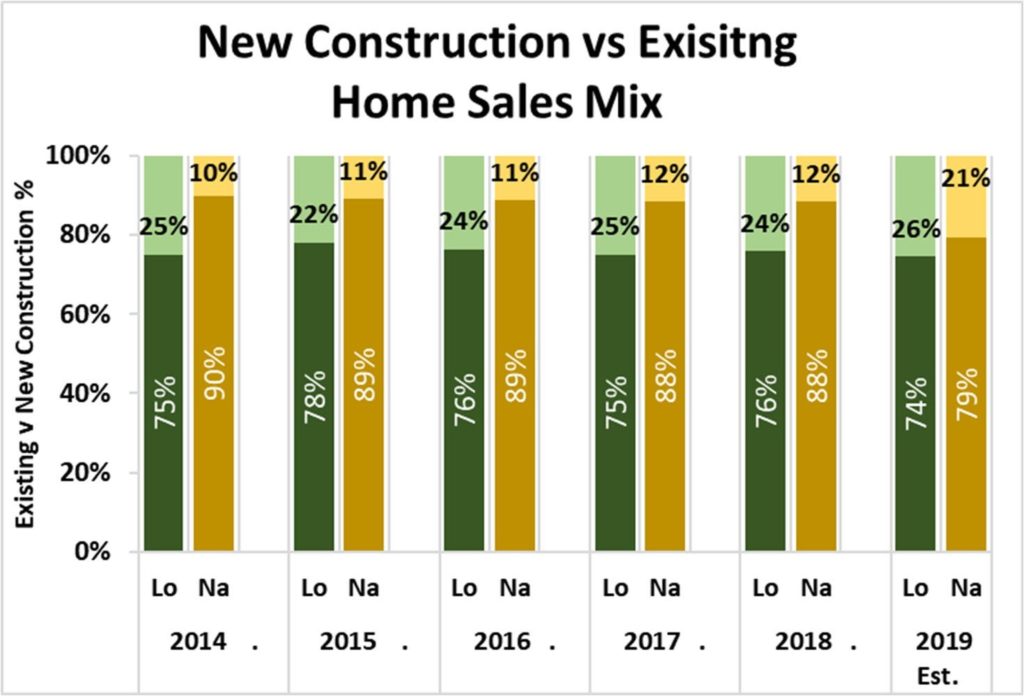
The percentage of all local residential real estate sales comprised by newly constructed homes has remained around 25% since 2015. Nationally, the percent of new construction sales surged in 2019 from about 11% to 21%. Figure 2 above compares the local and national composition of listed home sales in terms of existing and new homes sold. Note 2019 amounts are estimated based on 10 months of data.
Considering that the local Months of Supply has dropped to an extremely low level (1.8 months), local new construction will need to grow beyond one-fourth of listed residential real estate to meet the likely demand. See the discussion on population growth below.
Median Home Price
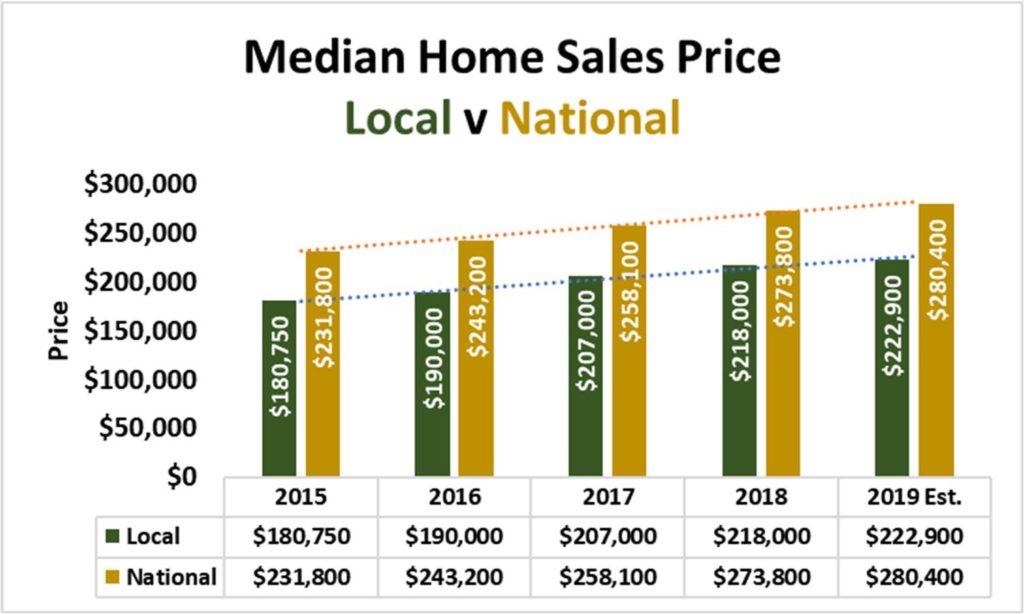
Home prices are rising locally and nationally at approximately the same rate of 4.5%. The median home price in the local area was $57,500 below the national median price in 2019 and $51,050 in 2015. The local median home sales price has risen 23% since 2015 while the national median price has risen 21%. There are many components that determine home prices including the demand for and supply of residential real estate. Figure 3 shows an annual comparison of median home price levels.
Market characteristics of population growth rate, participation in the labor force, and median household income are presented as indicators of changes in the demand for residential real estate. Growth in population suggests a growing number of people will create a need for more housing. Labor force participation and median household income provides insight into the local ability to afford homes. Overall, these three indicators suggest there are more people with the ability to afford homes today than in 2015 at both the local and national levels.
Population Growth
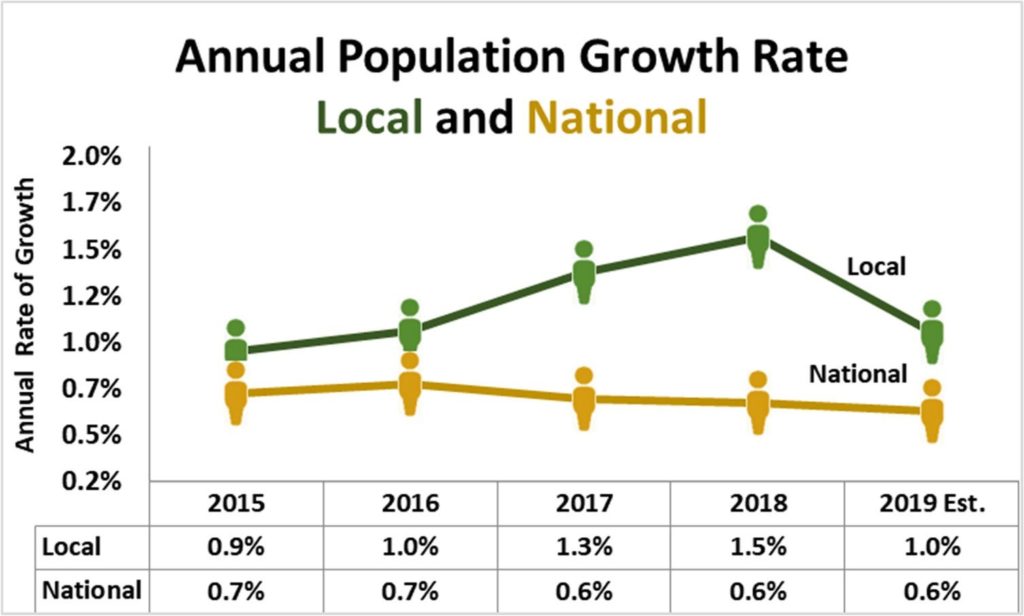
Demand for homes is affected by changes in population as well as employment opportunities. The Madison County area experienced significant annual growth in population ranging from 0.9% in 2015 to 1.5% in 2018. At least some of the dramatic decline in the local Months of Supply of listed homes (see Figure 1) may be attributable to the rising demand for housing in the local area from the growth in population. With the announced local industry expansions, continued growth in local population levels are likely to occur. Nationally, population has grown about 0.6% annually since 2015 but may be slowing. See Figure 4.
Population in the Labor Force
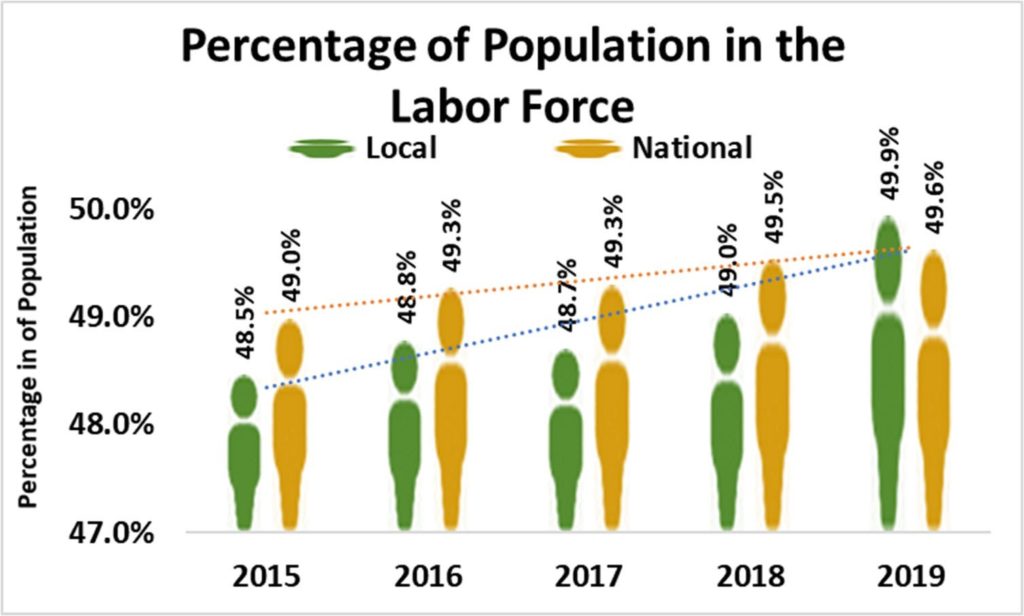
The percentage of the local population in the labor force (Figure 5) has been rising faster than and has exceeded the national average in 2019 at 49.9% locally compared to 49.6% nationally. The local increase since 2015 is 1.5 percentage points compared to 0.6 percentage points nationally. This metric may suggest a rise in the number of people with stable sources of income (representing ability to afford) will be able to purchase a home in the future.
Median Household Income Levels
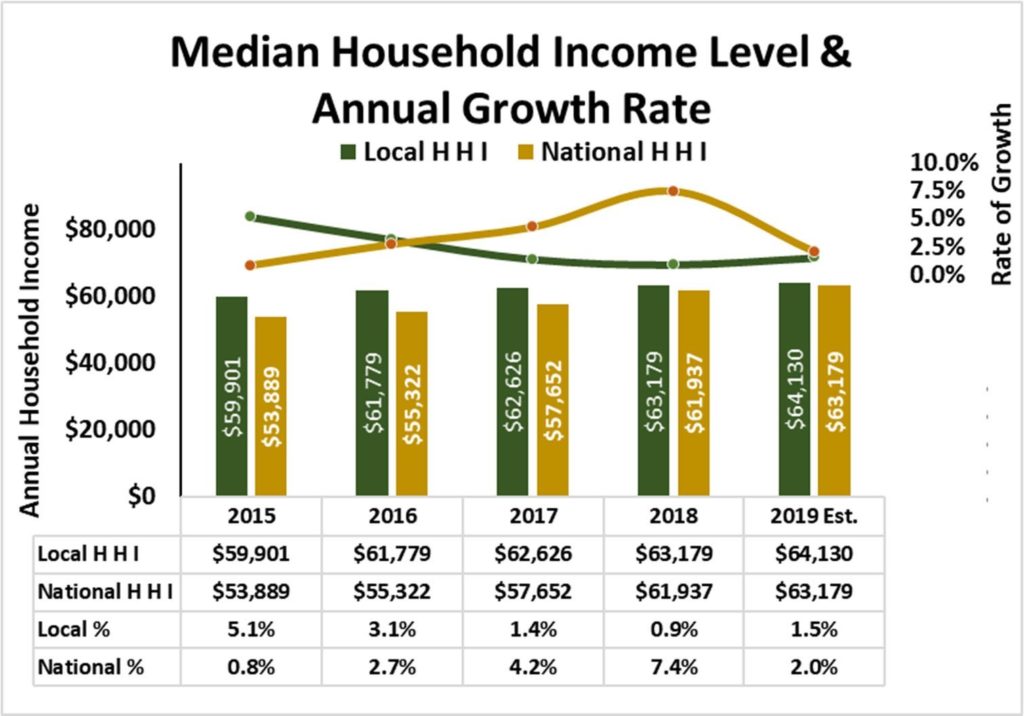
Local median household income levels continue to exceed the overall national level, but the national median appears to be catching up. The annual growth rate in the local market has slowed from 5.1% in 2015 to 1.5% in 2019. Nationally, the annual growth rate has accelerated from 0.8% in 2015 to 7.4% in 2018 and an estimated 2.0% in 2019. See Figure 6.
Conclusion
The Madison County, Alabama residential real estate market has outperformed the national market activity in several areas including a drop in months of supply, share of newly constructed homes out of total listed sales, and growth in median home price. Locally, robust sales have resulted in a low months of supply but has created challenges in meeting demand. The challenges, lack of available inventory and a local median home price 20% ($57,500) below the national level could stimulate new construction to meet demand.
The market characteristics of the local region are also strong, but the national averages are recovering to comparable levels. Growth in local population is a strong 1.0%-1.5% compared with a 0.6%-0.7% nationally. But, the local rate of growth slowed in 2019 while the national growth rate remains relatively modest at 0.6 percentage points.
Slightly more of the local population is engaged in the labor force (49.9%) than the national average of 49.6%. This suggests that there could be more people and families with the ability to purchase a home.
From the household perspective, median household income continues to rise at a modest rate both locally and nationally. Local household income in 2019 was approximately $64,130 compared with $63,179 nationally for a local advantage of $650 in 2019 compared with the local advantage of $6,012 in 2015. Growth over the past five years suggests that national median household income is improving quickly.
All things considered, the demand for local residential real estate appears to be outpacing the supply of available listed homes. Given recent economic development announcements, the high demand for residential real estate may continue for a while. The comparison of the local and national residential real estate markets shows that the Madison County, Alabama market has been and should continue to be strong in the coming months. It is important to note that unexpected shocks to the economy at the local or national level could affect housing supply and/or demand.
Primary Data Sources:
Analysis & Report Prepared By:
Questions regarding this report should be directed to:
Jeff Thompson, jeff.thompson@uah.edu, 256.361.9065
This report will be updated with the final 2019 data in early 2020.