Inform | Influence | Empower

Website Search:

News

Huntsville Real Estate Market Update

08/24/2026

Late-Summer Market Dynamics

The Huntsville housing market maintained a measured, steady pace through mid-August. While higher interest rates and elevated consumer price pressures continue to test buyer purchasing power, market fundamentals demonstrate strong resilience.
Pending sales for both single-family properties and townhouses/condos showed substantial year-over-year growth during the week ending August 15. At the same time, single-family inventory has expanded steadily, giving buyers more options while maintaining balanced pricing power for sellers.
Here is your detailed breakdown of the weekly and monthly market activity across Madison County.

Read more REALTOR news at haar.realtor/news

Key Market Indicators at a Glance

Single-Family Residential Overview

  • New Listings (Week Ending Aug 15): 161 (Down 9.0% YoY)

  • Pending Sales (Week Ending Aug 15): 148 (Up 9.6% YoY)

  • Active Inventory (Week Ending Aug 15): 2,263 (Up 8.2% YoY)

  • Median Sales Price (July 2026): $345,750 (Up 1.7% YoY)

  • Days on Market (July 2026): 44 days (Up 4.8% YoY)

  • Percent of List Price Received (July 2026): 98.8% (Up 0.2% YoY)

  • Months Supply of Inventory (July 2026): 4.0 Months (Down 2.4% YoY)

Deep-Dive Analysis for HAAR Professionals

Supply vs. Buyer Demand Trends

Despite new listings falling 9.0% week-over-week, pending sales surged by +9.6% to 148 contracts. The 3-month average for pending sales remains up 12.0% compared to last year, showing strong underlying buyer demand.

Mortgage Rates & Macroeconomic Conditions

According to Freddie Mac, the 30-year fixed-rate mortgage averaged 6.67% as of August 13, 2026. While slightly down from the previous week’s 6.69%, this represents an increase from 6.58% recorded a year ago. Compounded by broader consumer inflation at the pump and retail stores, buyers face tightened purchasing constraints, reinforcing the need for strategic pricing and rate-buydown options.

Pricing Stability & Seller Expectations

Single-family homes continue to demonstrate price stability. The July median sales price reached $345,750 (+1.7% YoY), and sellers are securing 98.8% of their original list price.

Actionable Takeaways for REALTORS®

  1. Guide Single-Family Sellers on Pricing: With a 4.0-month supply and an average 44 days on market, single-family homes are in balanced territory. Emphasize accurate initial pricing to capture buyer interest within the first 30 days.
  2. Leverage Rate Concessions: With mortgage rates averaging 6.67%, discuss seller-funded temporary or permanent rate buydowns with your clients. This strategy often yields better buyer qualification than direct price cuts.
  3. Position Condo/Townhouse Listings Competitively: A 6.3-month supply indicates higher competition in the townhouse/condo space. Staging, competitive pricing, and buyer incentives are critical for listings taking an average of 69 days to sell.
Read More

Weekly Huntsville Real Estate Market Update

08/18/2026

The mid-August market data for Madison County shows divergent trajectories between single-family homes and the townhouse/condo segment. As national trends reflect sluggish sales volumes amid persistent price levels, local activity highlights steady single-family momentum alongside growing inventory in attached housing.

Weekly Snapshot (Week Ending August 8, 2026)

Single-Family Homes: New listings rose 25.7% year-over-year to 191. Pending sales increased by 5.6% to 133, while total available inventory rose 6.6% to 2,247 units.

Monthly Performance Summary (July 2026)

  • Median Sales Price: Single-family median sales prices increased 1.5% year-over-year to $345,000. Conversely, townhouse/condo median prices fell 8.3% to $267,900.
  • Days on Market (DOM): Single-family DOM edged up slightly by 2.4% to 43 days. Townhouses and condos averaged 69 days on market, remaining unchanged from July 2025.
  • List Price Received: Sellers maintained solid pricing leverage, receiving 98.8% of list price for single-family homes (+0.2%) and 98.4% for townhouses/condos (+0.7%).
  • Months Supply of Inventory: Single-family supply contracted slightly by 4.9% to 3.9 months. Townhouse/condo supply expanded significantly by 59.0% to 6.2 months, indicating a shift toward buyer-friendly conditions in that sector.

Key Takeaways for REALTORS®

  • Single-Family Resilience: Demand remains steady for detached single-family properties, with healthy list-to-sale price ratios (98.8%) and sub-4-month inventory levels.
  • Condo/Townhouse Dynamics: Expanding months supply (6.2 months) and longer market times (69 days) point to increased negotiation leverage for buyers looking at attached homes.
  • Macro Environment: The national “lock-in effect” continues to affect inventory broader-scale, but local single-family seller activity showed an encouraging boost in early August.
Read More

June 2026 Fast Stats: North Alabama real estate market update

08/15/2026

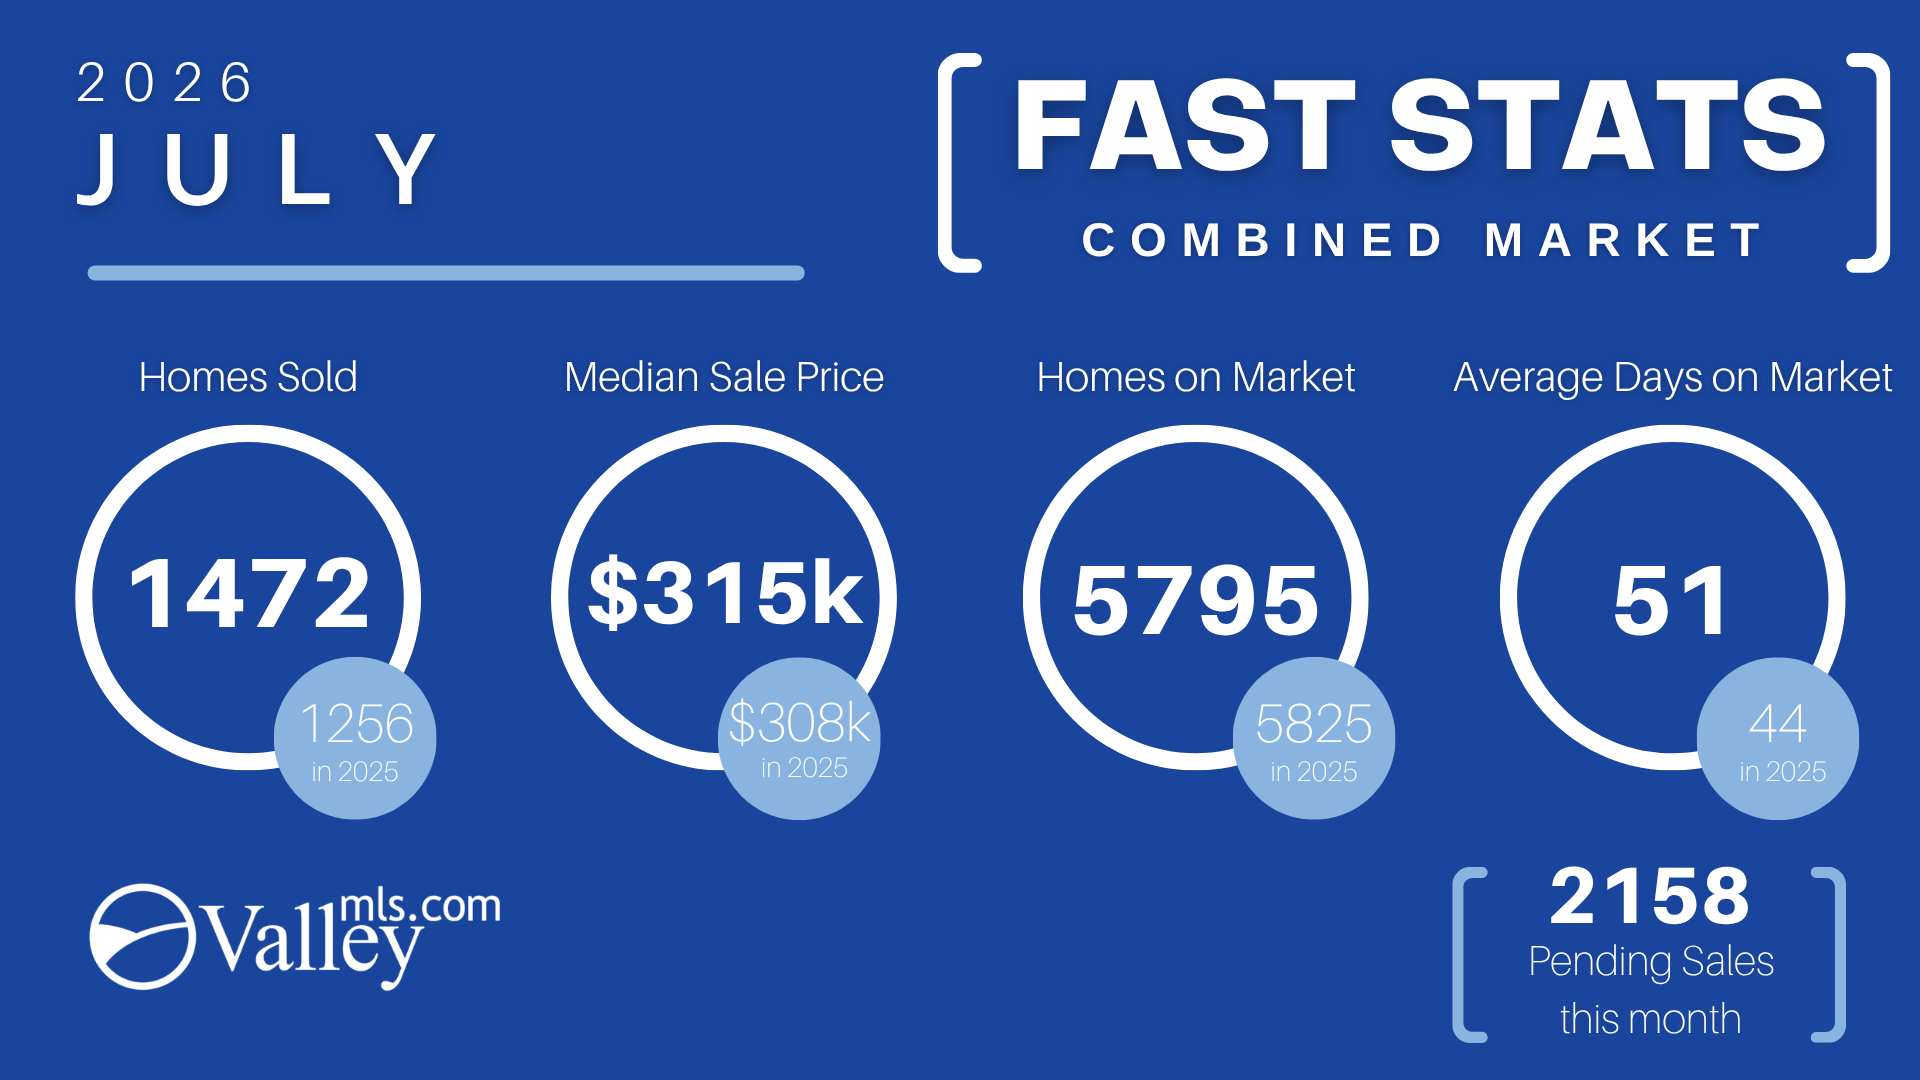
The July 2026 North Alabama real estate market update is in. Staying ahead of regional inventory shifts, sales volume, and pricing trends is essential for positioning your listings, setting seller expectations, and advising home buyers.

Across the Combined Market, home sales surged year-over-year while median prices nudged higher, signalling strong ongoing buyer demand throughout the region. Below is your comprehensive, area-by-area breakdown of the latest ValleyMLS statistics.

📊 North Alabama Real Estate Market Update Combined Overview

Across all primary submarkets, sales activity posted a significant year-over-year increase, supported by robust pending sales pipelines entering late summer.

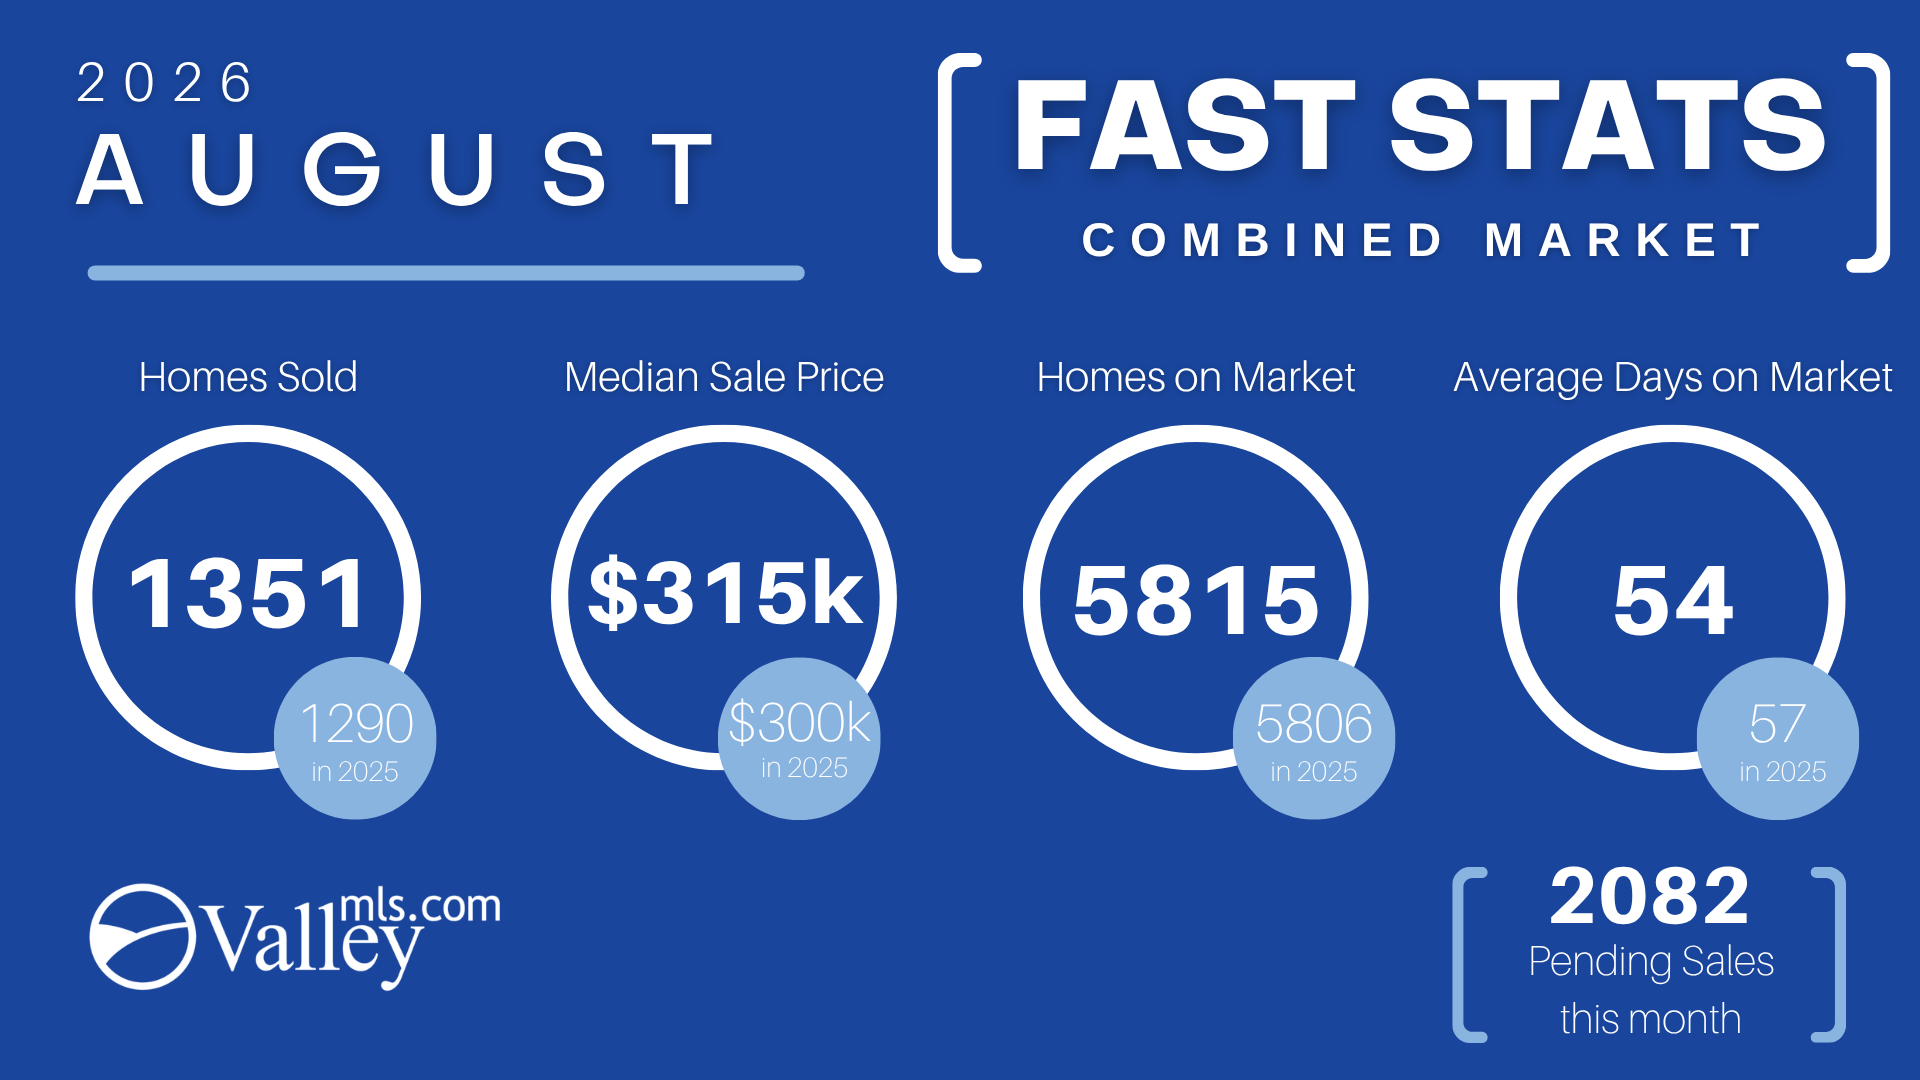
  • Homes Sold: 1,472 (Up from 1,256 in July 2025)

  • Median Sale Price: $315,000 (Up from $308,000 in July 2025)

  • Homes on Market (Inventory): 5,795 (Slightly down from 5,825 in July 2025)

  • Average Days on Market (DOM): 51 days (Up from 44 days in July 2025)

  • Pending Sales: 2,158 active under-contract properties

REALTOR® Takeaway: The broader market displays strong underlying momentum. Higher sales volume paired with consistent median price growth demonstrates healthy market demand despite properties taking slightly longer to close.

📍 Local Market Breakdown by Region

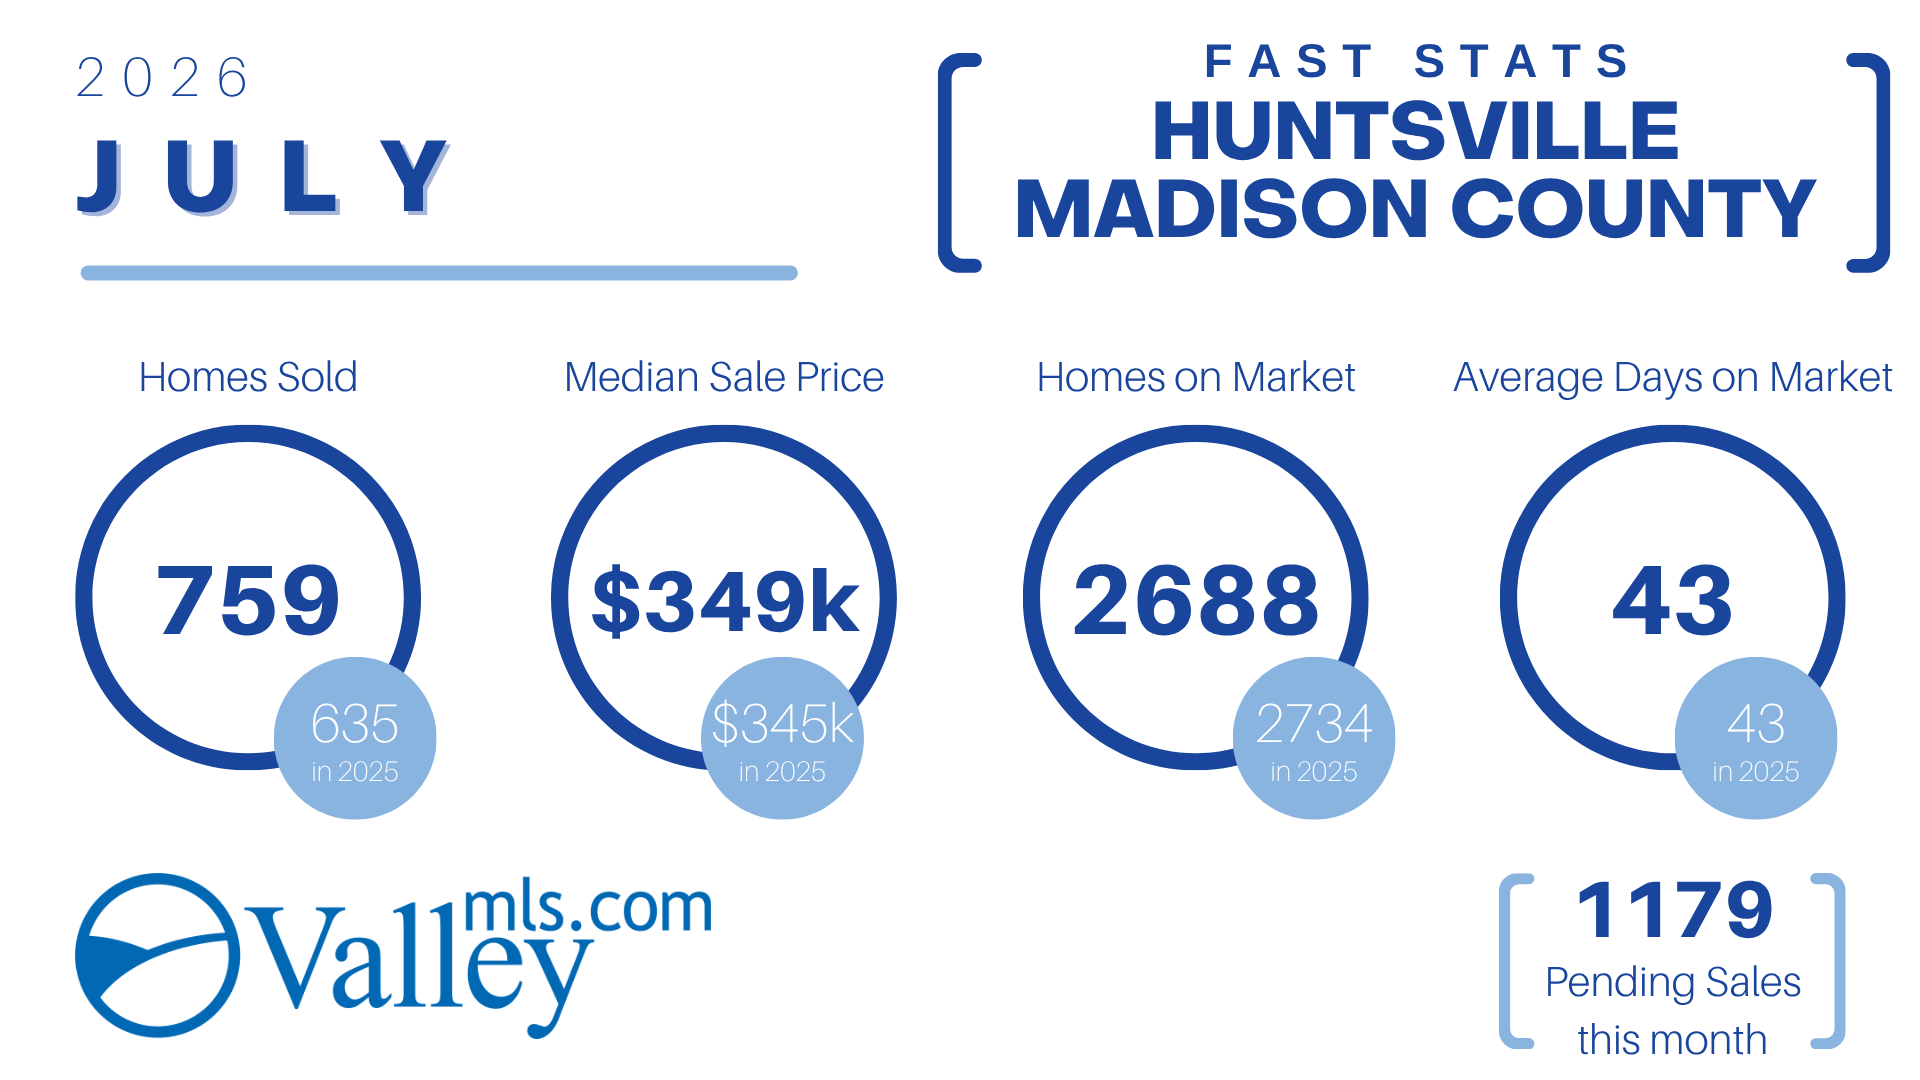
Huntsville & Madison County

The region’s core engine saw strong demand, driven by a sharp rise in total closed units year-over-year while DOM remained exceptionally tight.

Metric

Homes Sold
Median Sale Price
Homes on Market
Average DOM
Pending Sales

July 2026

759
$349k
2,688
43 days
1,179

July 2025

635

$345k

2,734
43 days
740

Trend

🟢 +19.5%
🟢 +1.1%
🔴 -1.7%
⚪ Flat
High Pipeline

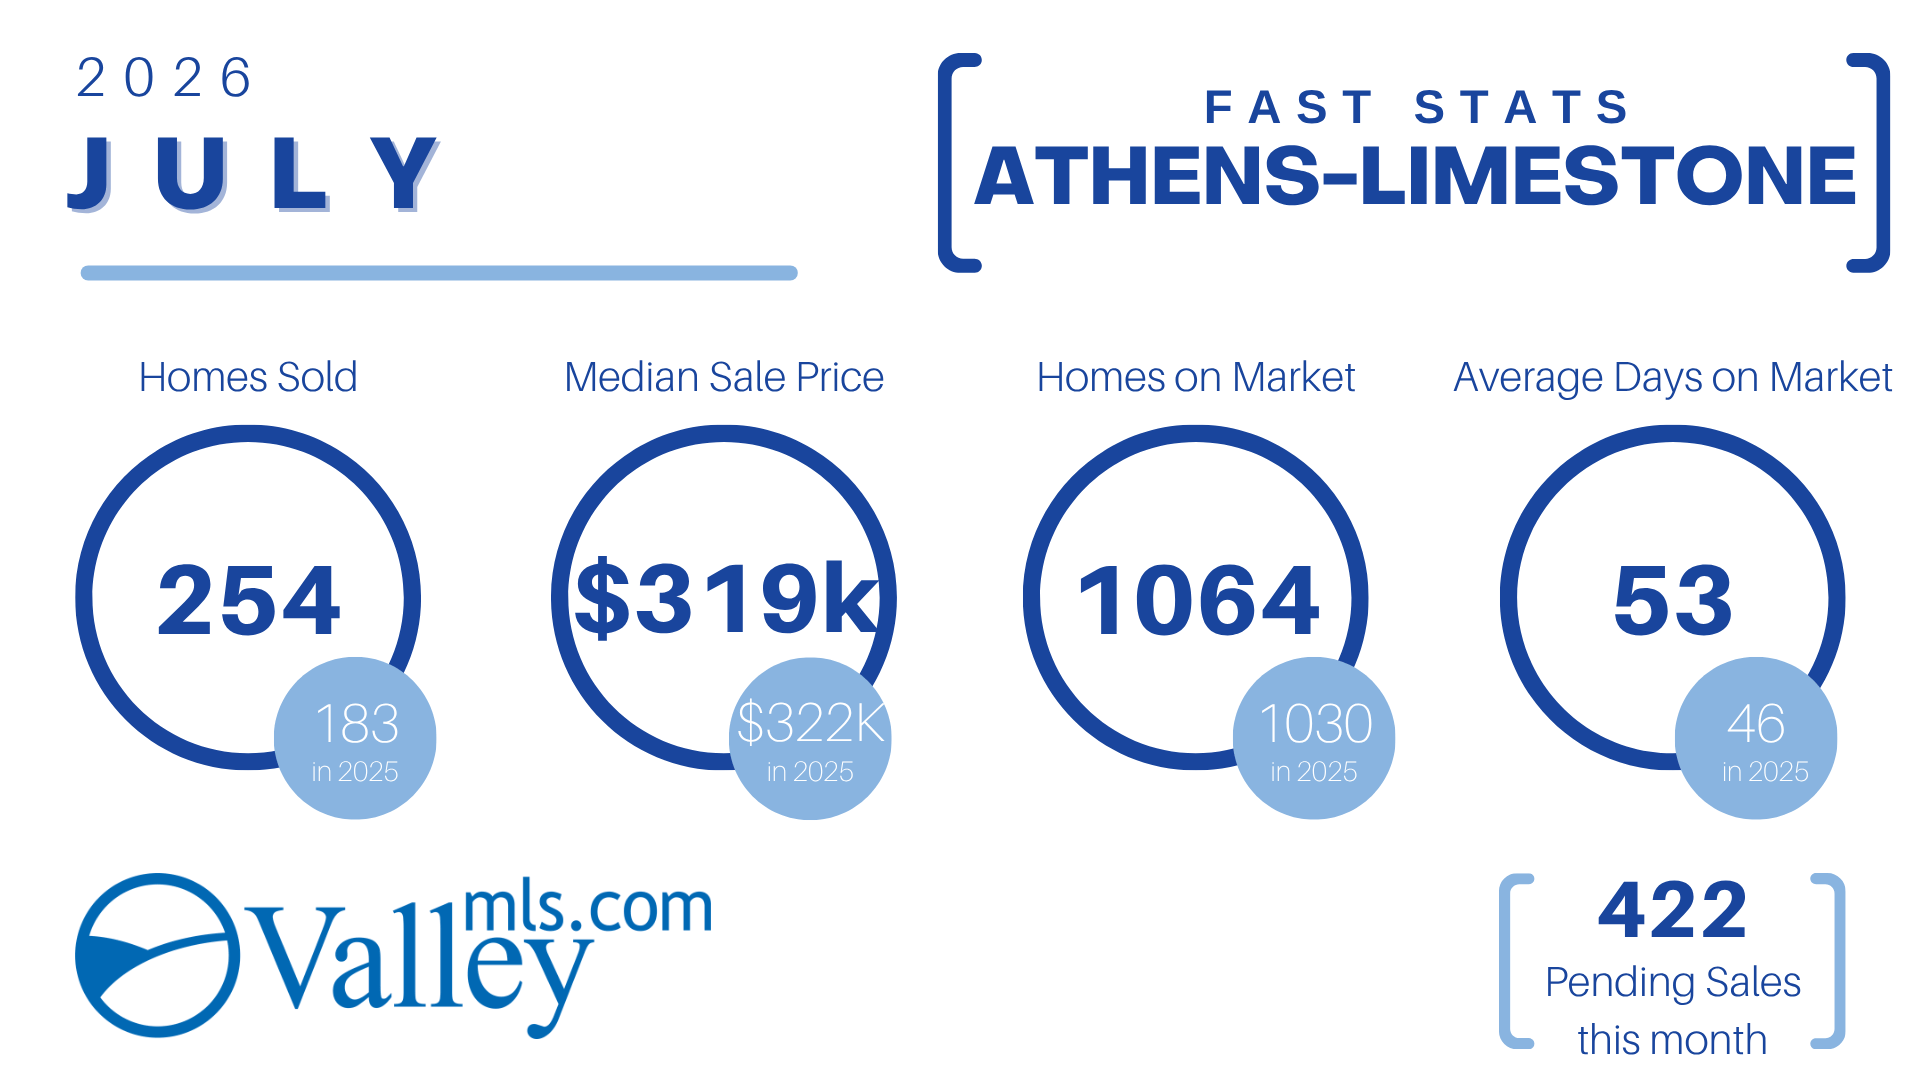
Athens & Limestone County

Limestone County experienced a major leap in completed transactions, alongside a modest correction in median price.

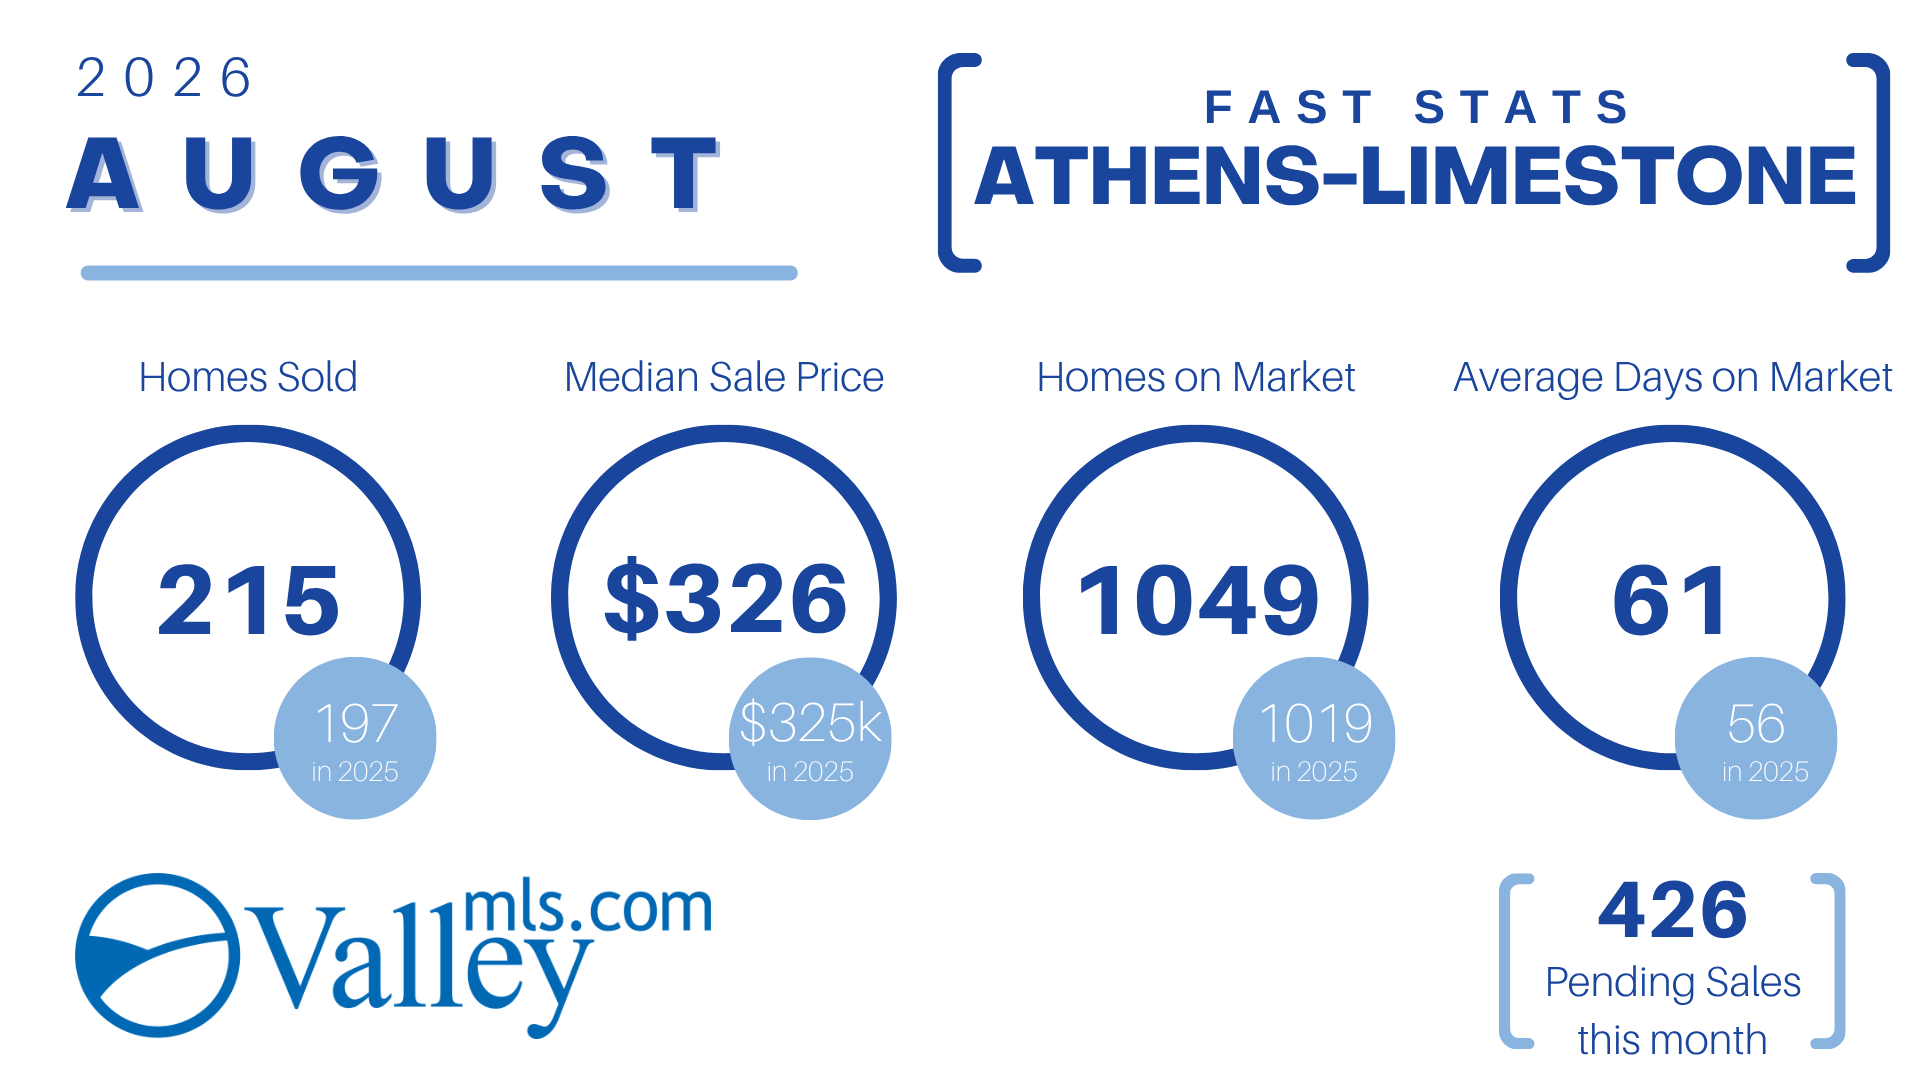
  • Homes Sold: 254 (vs. 183 in 2025)

  • Median Sale Price: $319,000 (vs. $322,000 in 2025)

  • Active Listings: 1,064 (vs. 1,030 in 2025)

  • Avg. Days on Market: 53 days (vs. 46 days in 2025)

  • Pending Sales: 422

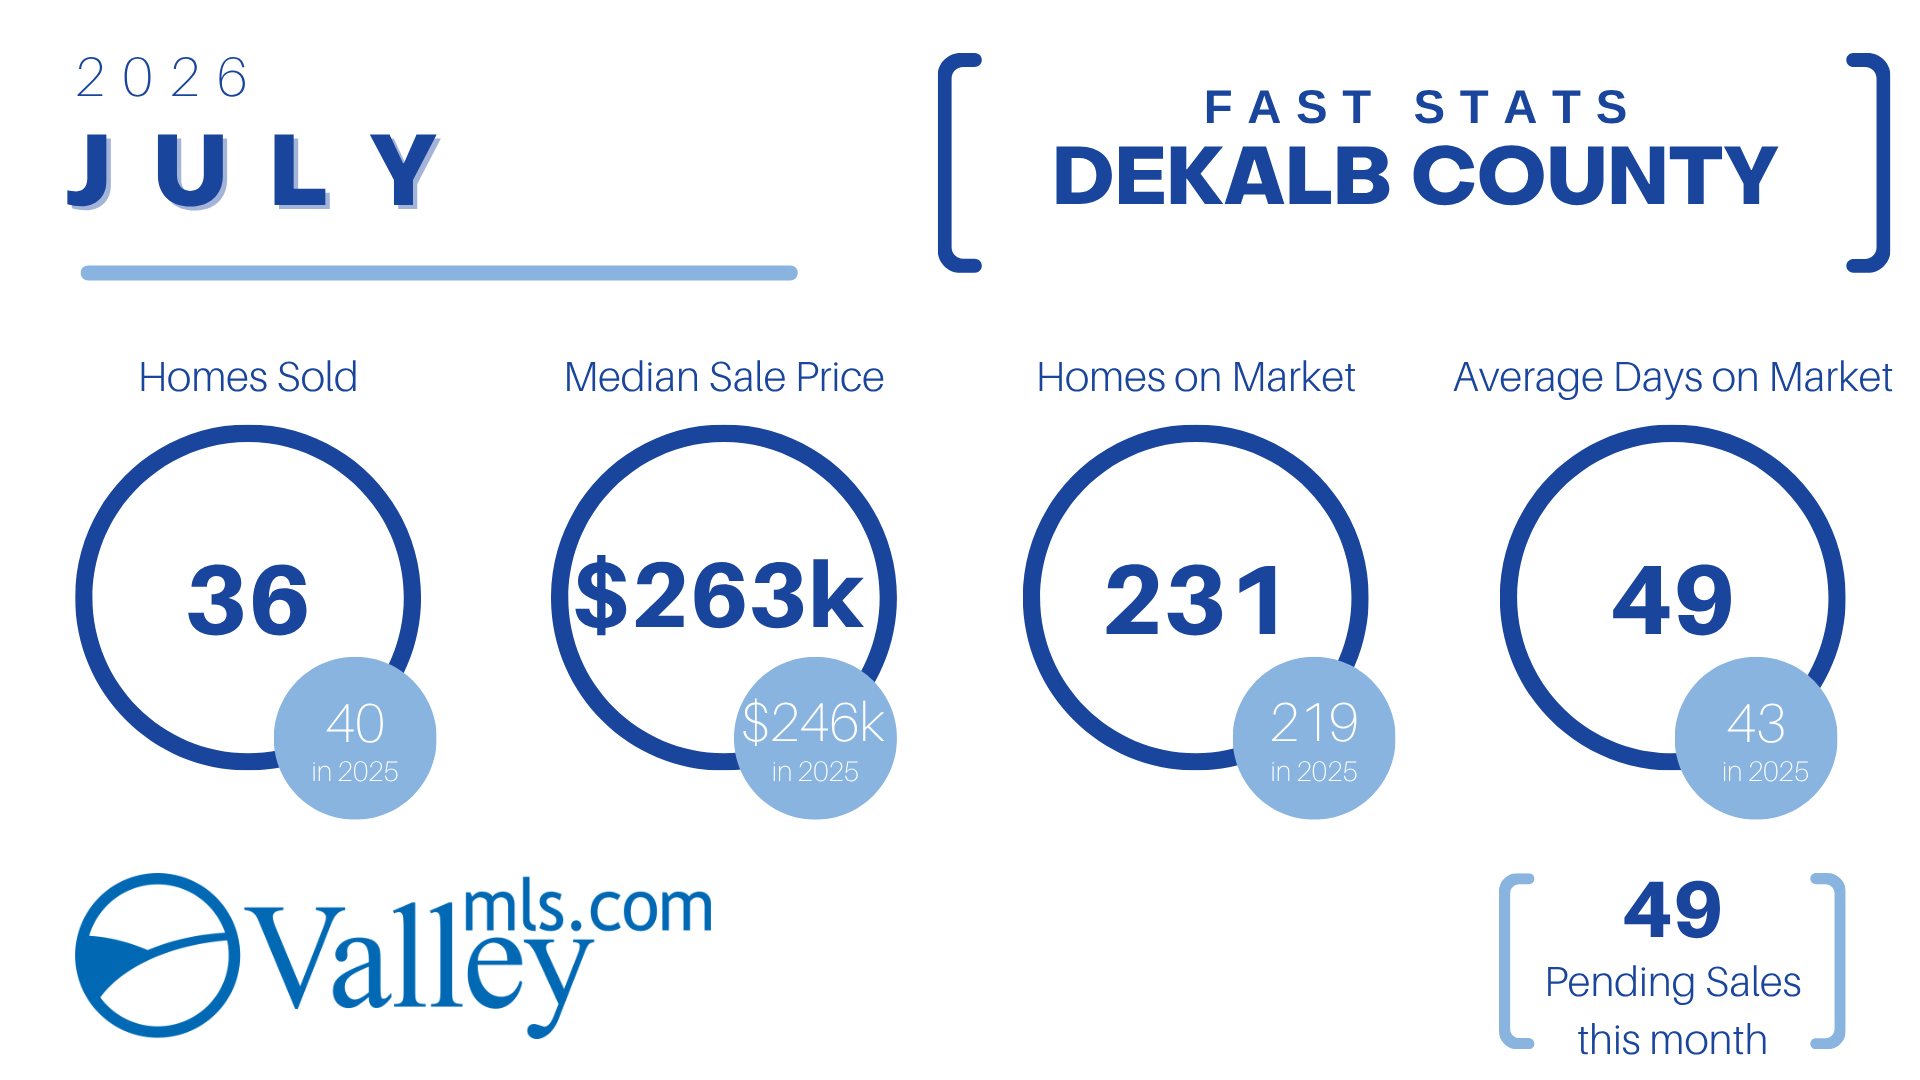
DeKalb County

DeKalb experienced steady median price appreciation while total inventory saw a slight expansion.

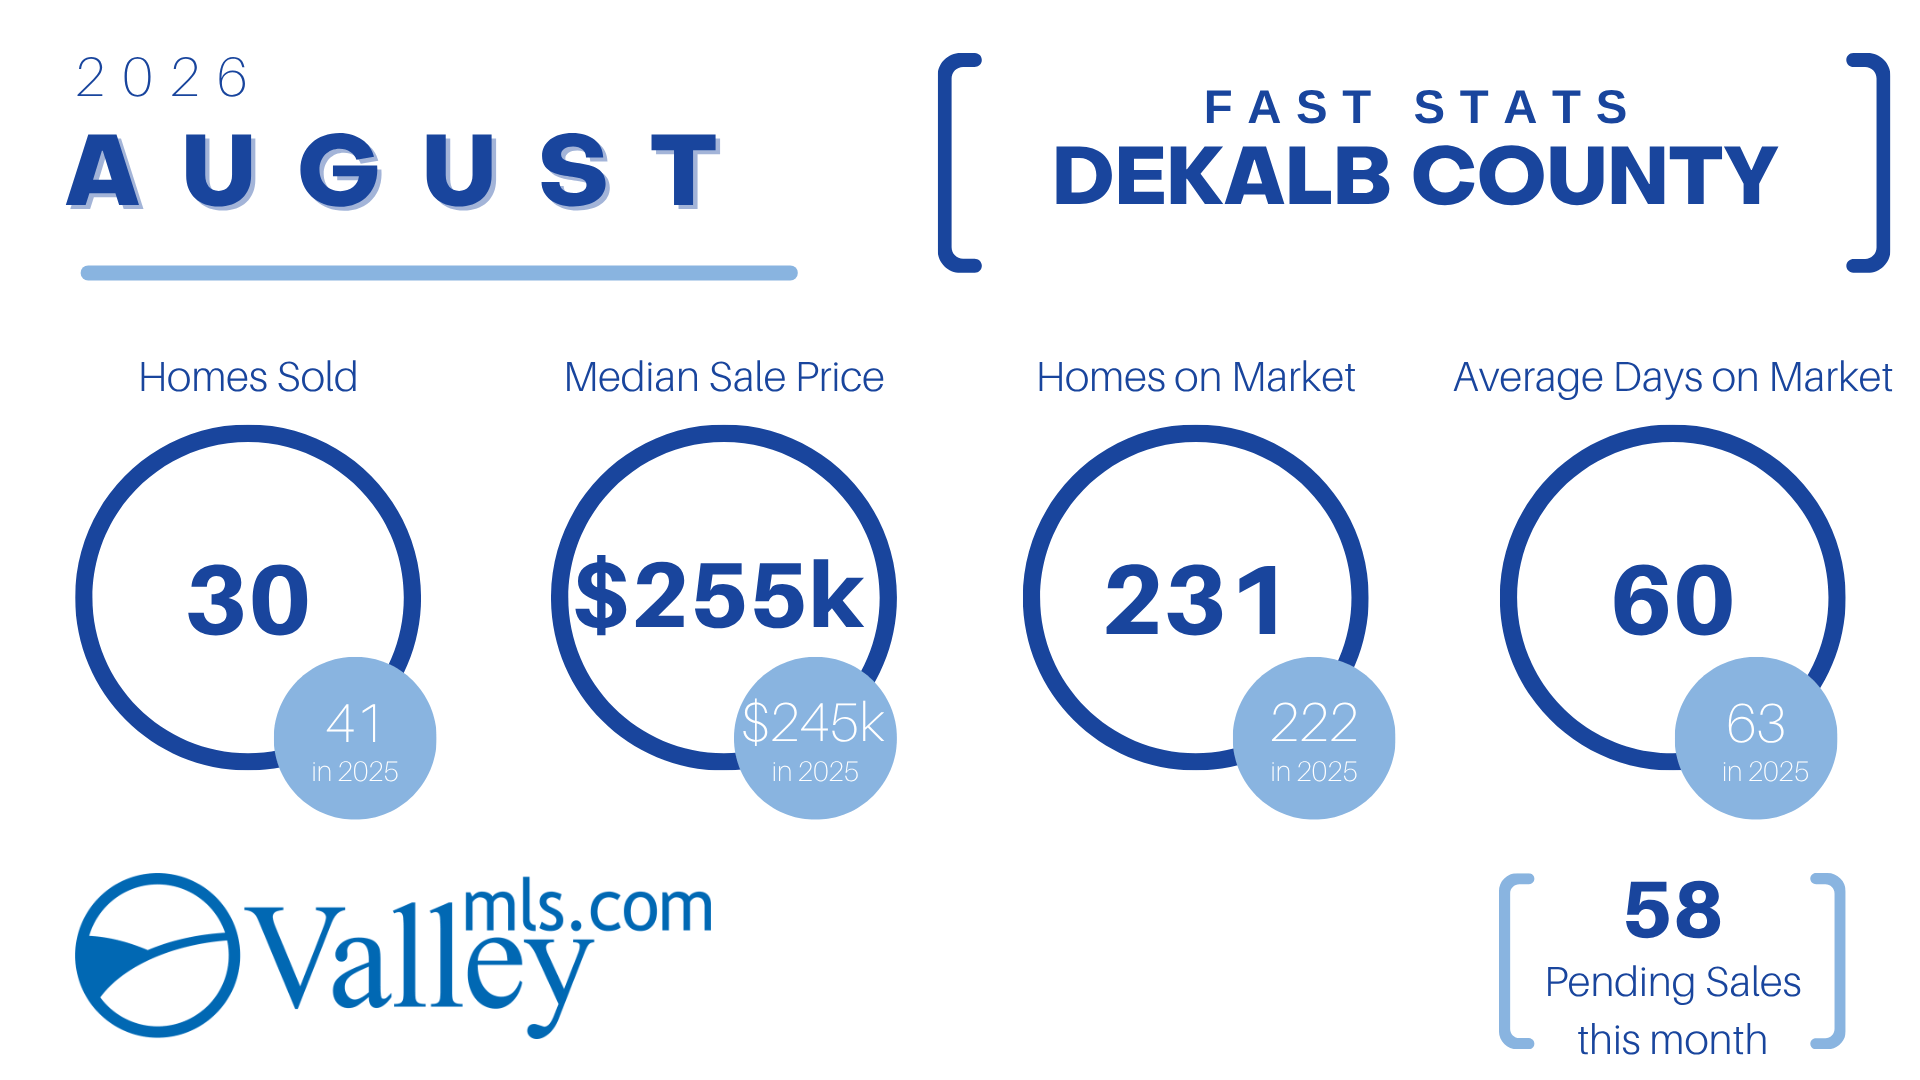
  • Homes Sold: 36 (vs. 40 in 2025)

  • Median Sale Price: $263,000 (vs. $246,000 in 2025)

  • Active Listings: 231 (vs. 219 in 2025)

  • Avg. Days on Market: 49 days (vs. 43 days in 2025)

  • Pending Sales: 49

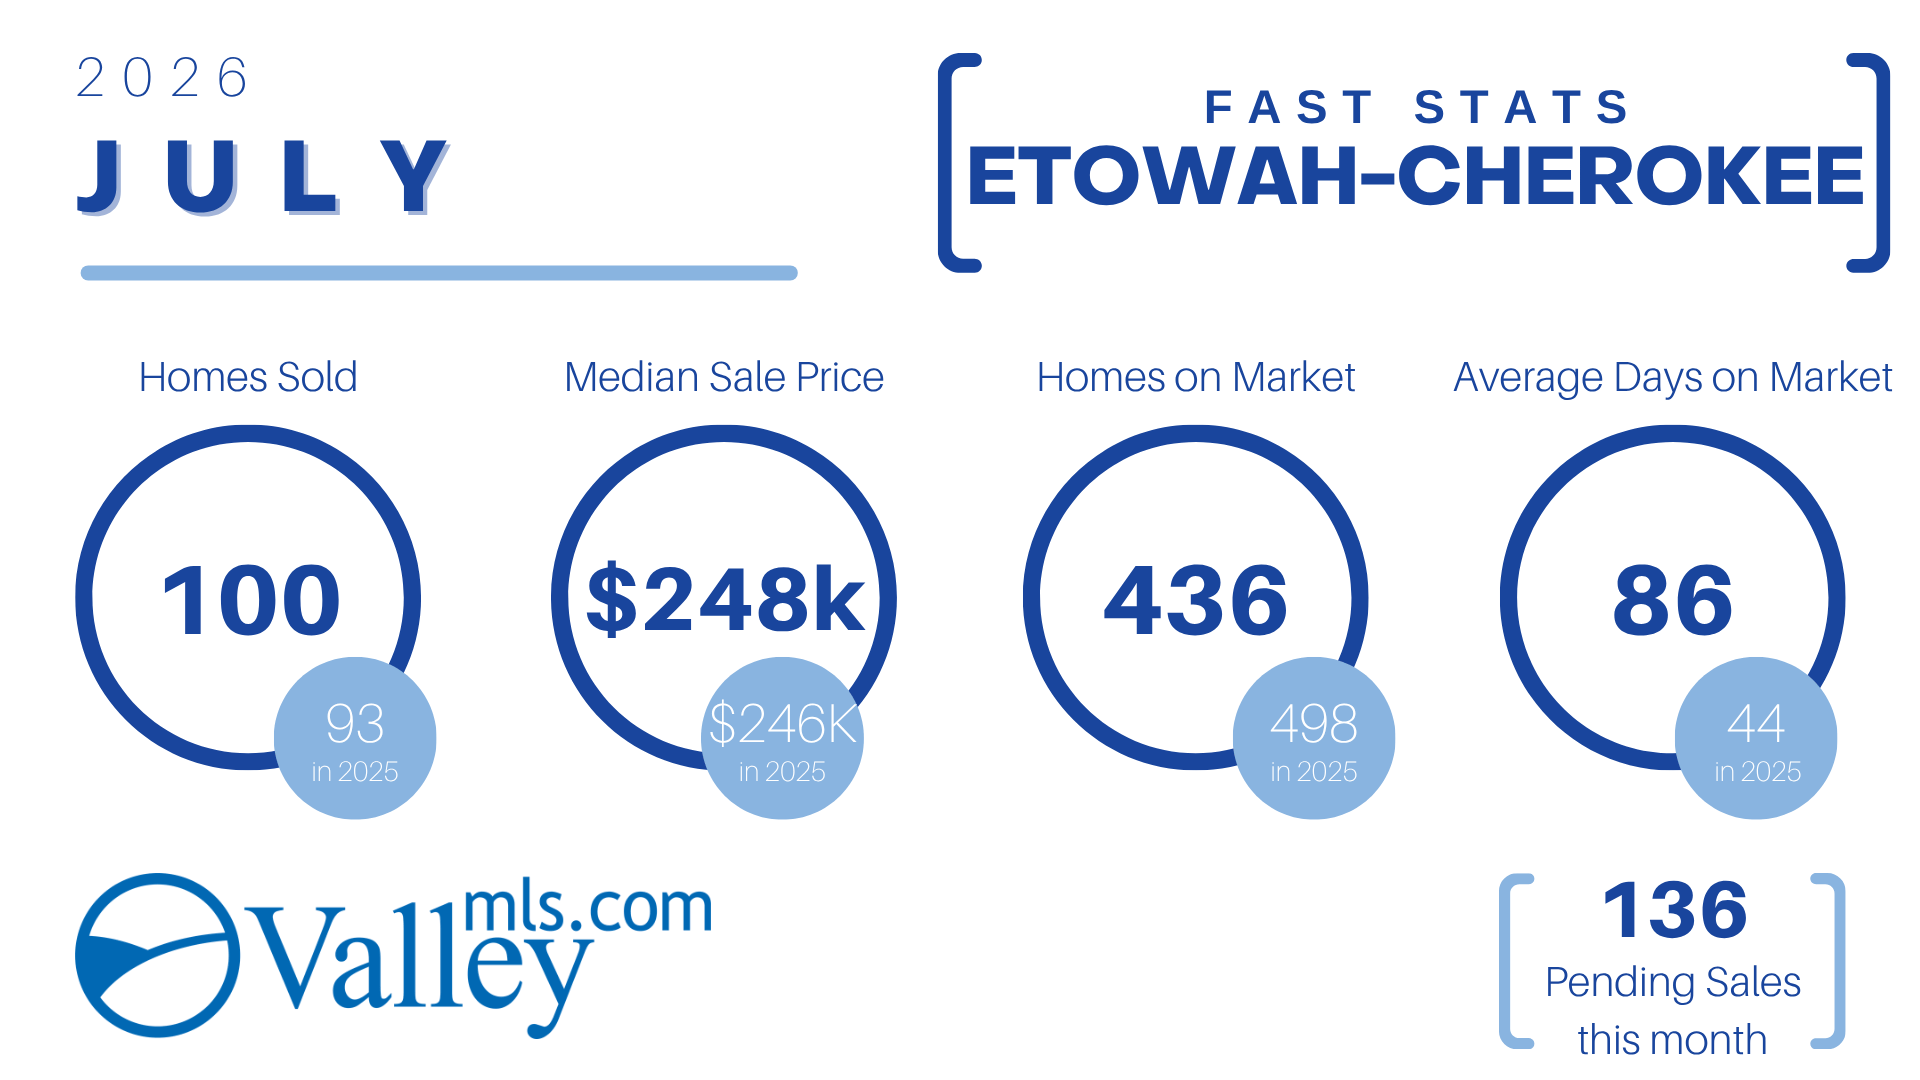
Etowah & Cherokee Counties

While days on market extended, overall sales increased and pricing remained firm.

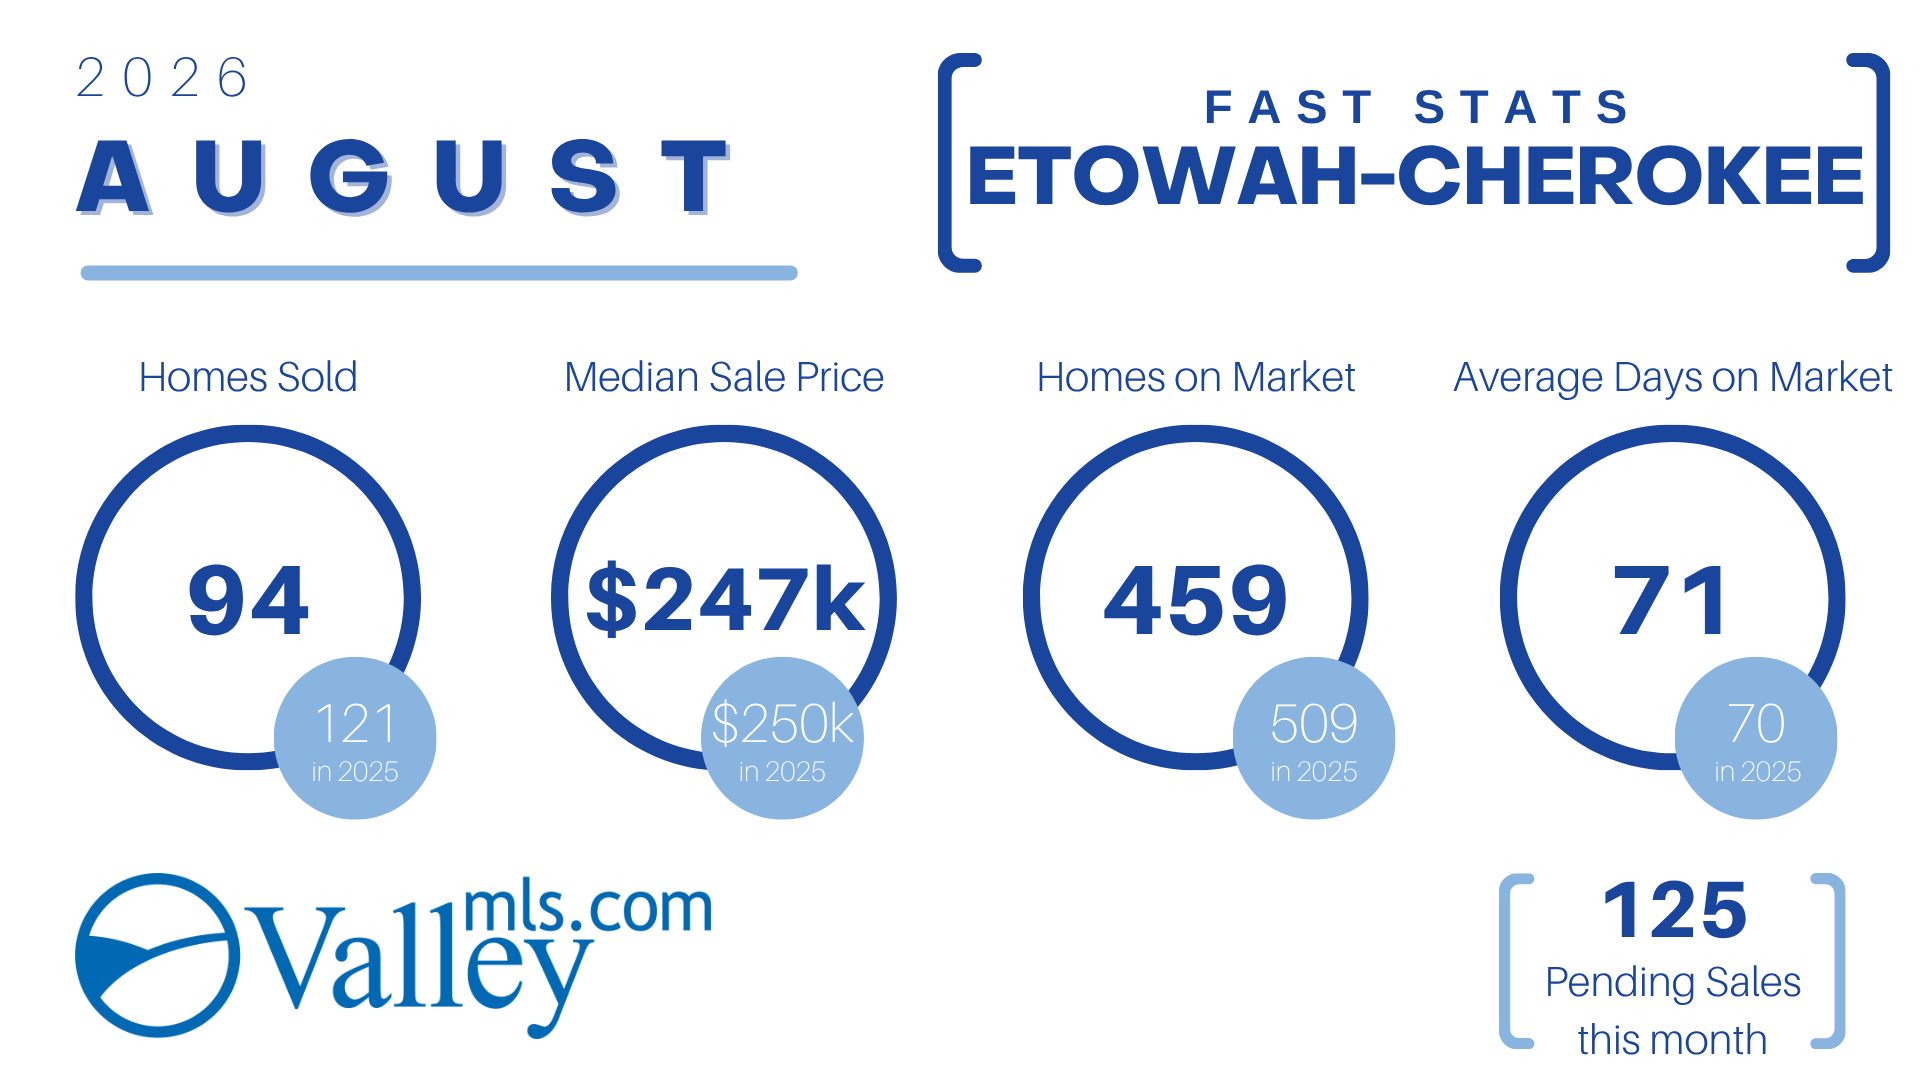
  • Homes Sold: 100 (vs. 93 in 2025)

  • Median Sale Price: $248,000 (vs. $246,000 in 2025)

  • Active Listings: 436 (vs. 498 in 2025)

  • Avg. Days on Market: 86 days (vs. 44 days in 2025)

  • Pending Sales: 136

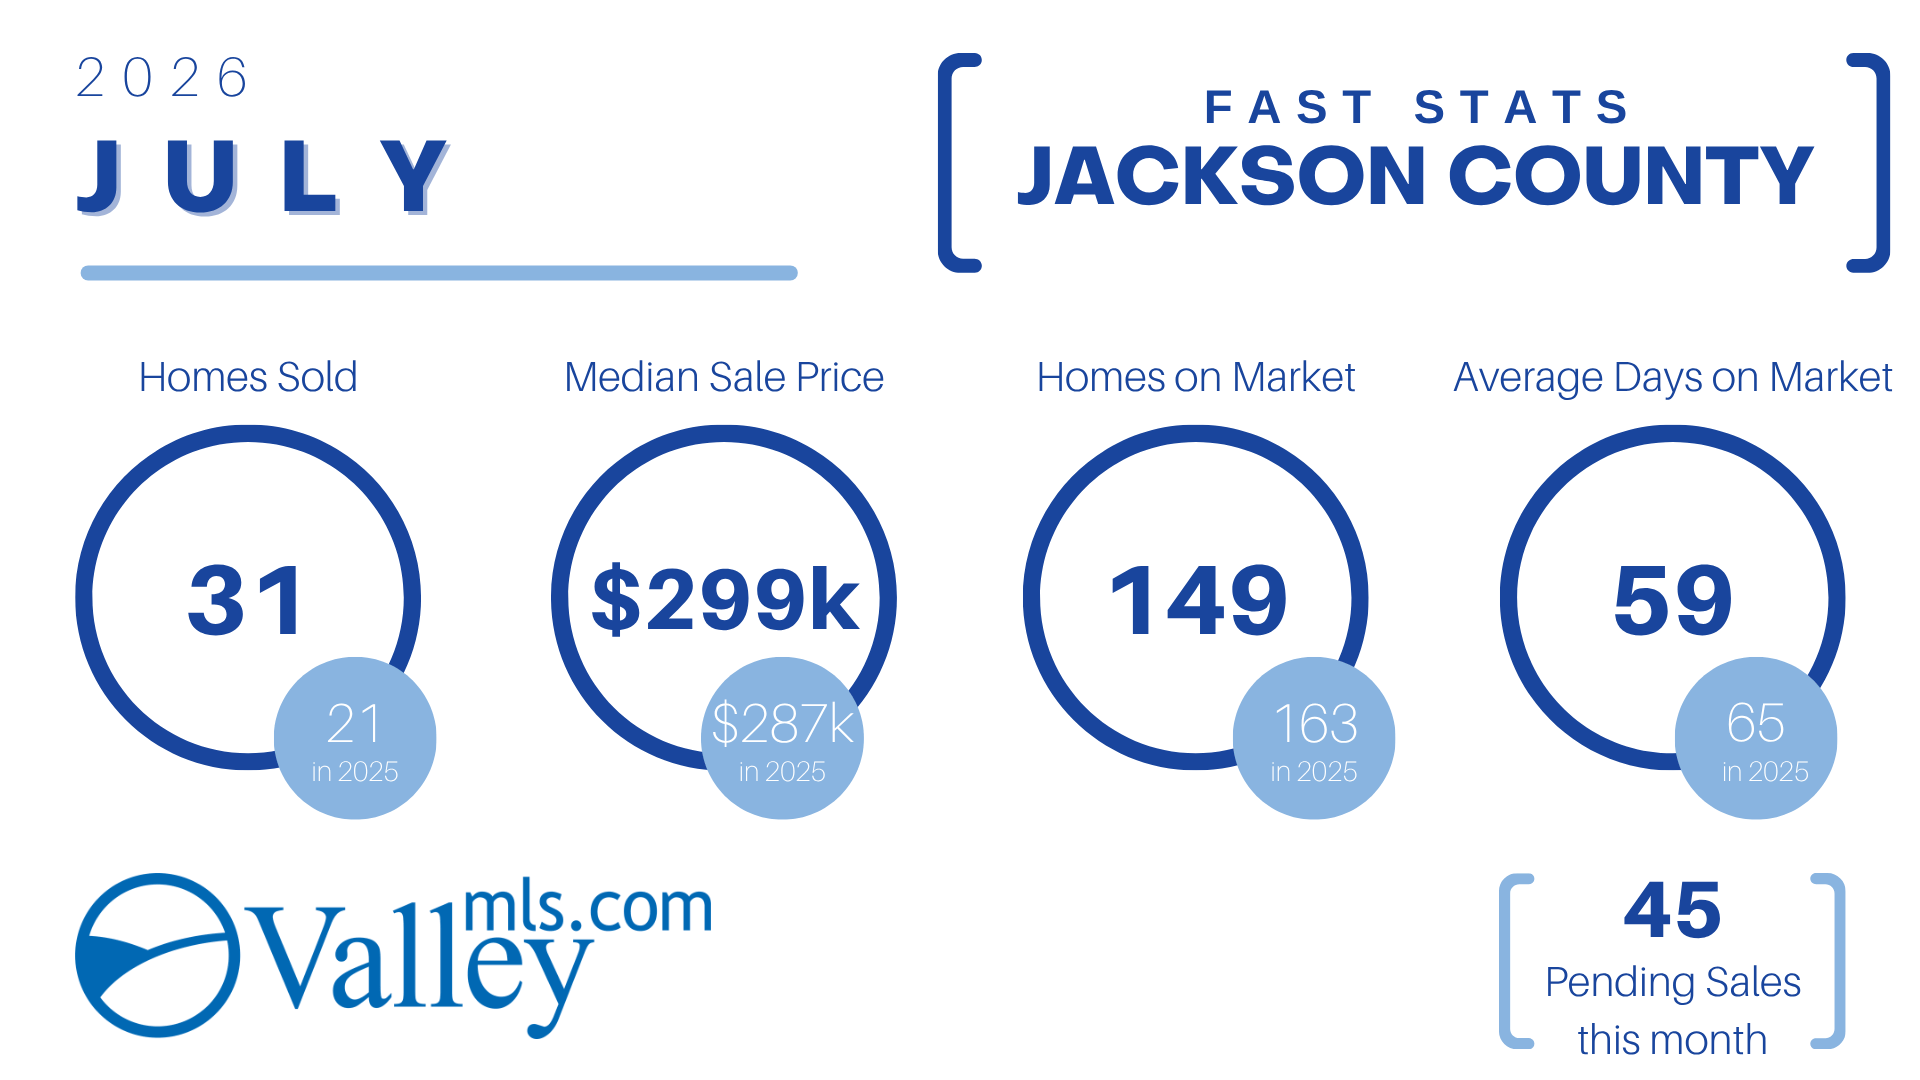
Jackson County

Jackson County saw sales jump by nearly 48% year-over-year, making it one of the top growth markets in unit volume.

  • Homes Sold: 31 (vs. 21 in 2025)

  • Median Sale Price: $299,000 (vs. $287,000 in 2025)

  • Active Listings: 149 (vs. 163 in 2025)

  • Avg. Days on Market: 59 days (Down from 65 days in 2025)

  • Pending Sales: 45

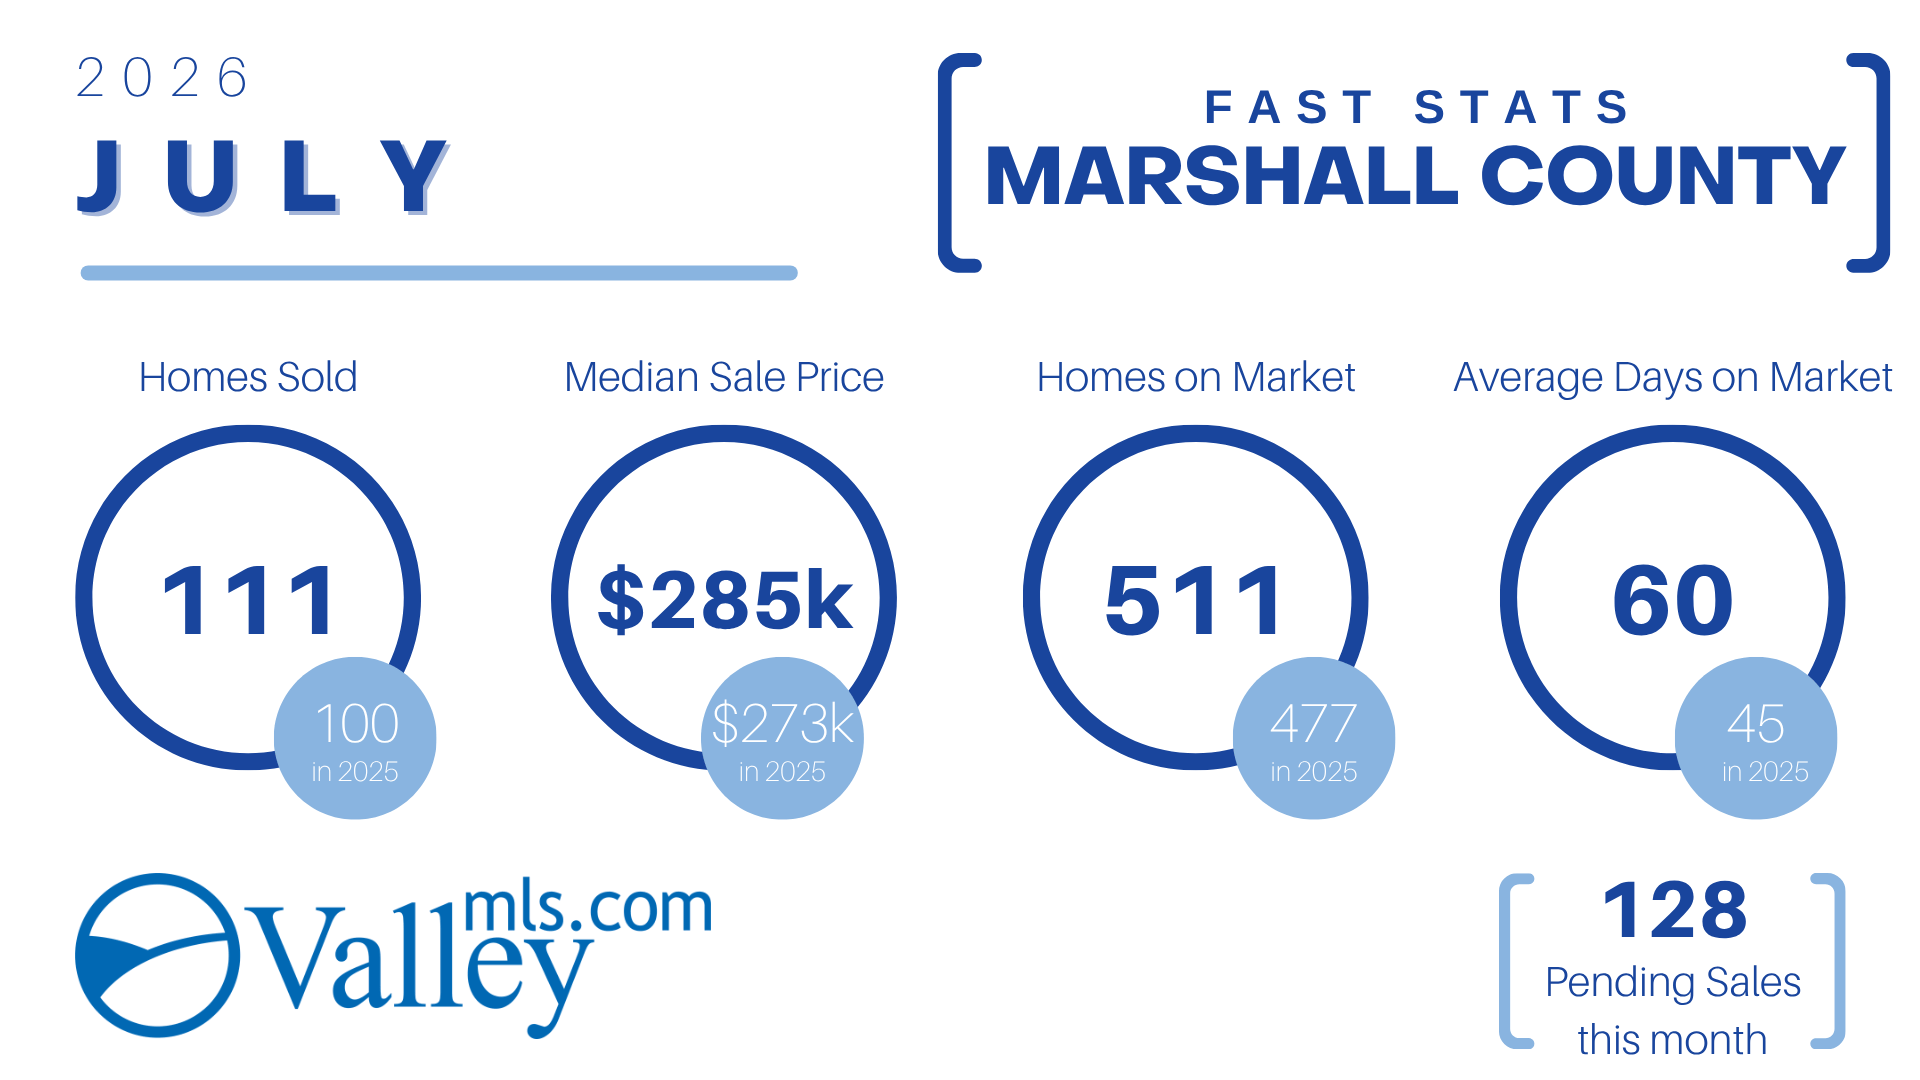
Marshall County

Marshall County demonstrated gains in price appreciation, with home prices rising by over $12,000 year-over-year.

  • Homes Sold: 111 (vs. 100 in 2025)

  • Median Sale Price: $285,000 (vs. $273,000 in 2025)

  • Active Listings: 511 (vs. 477 in 2025)

  • Avg. Days on Market: 60 days (vs. 45 days in 2025)

  • Pending Sales: 128

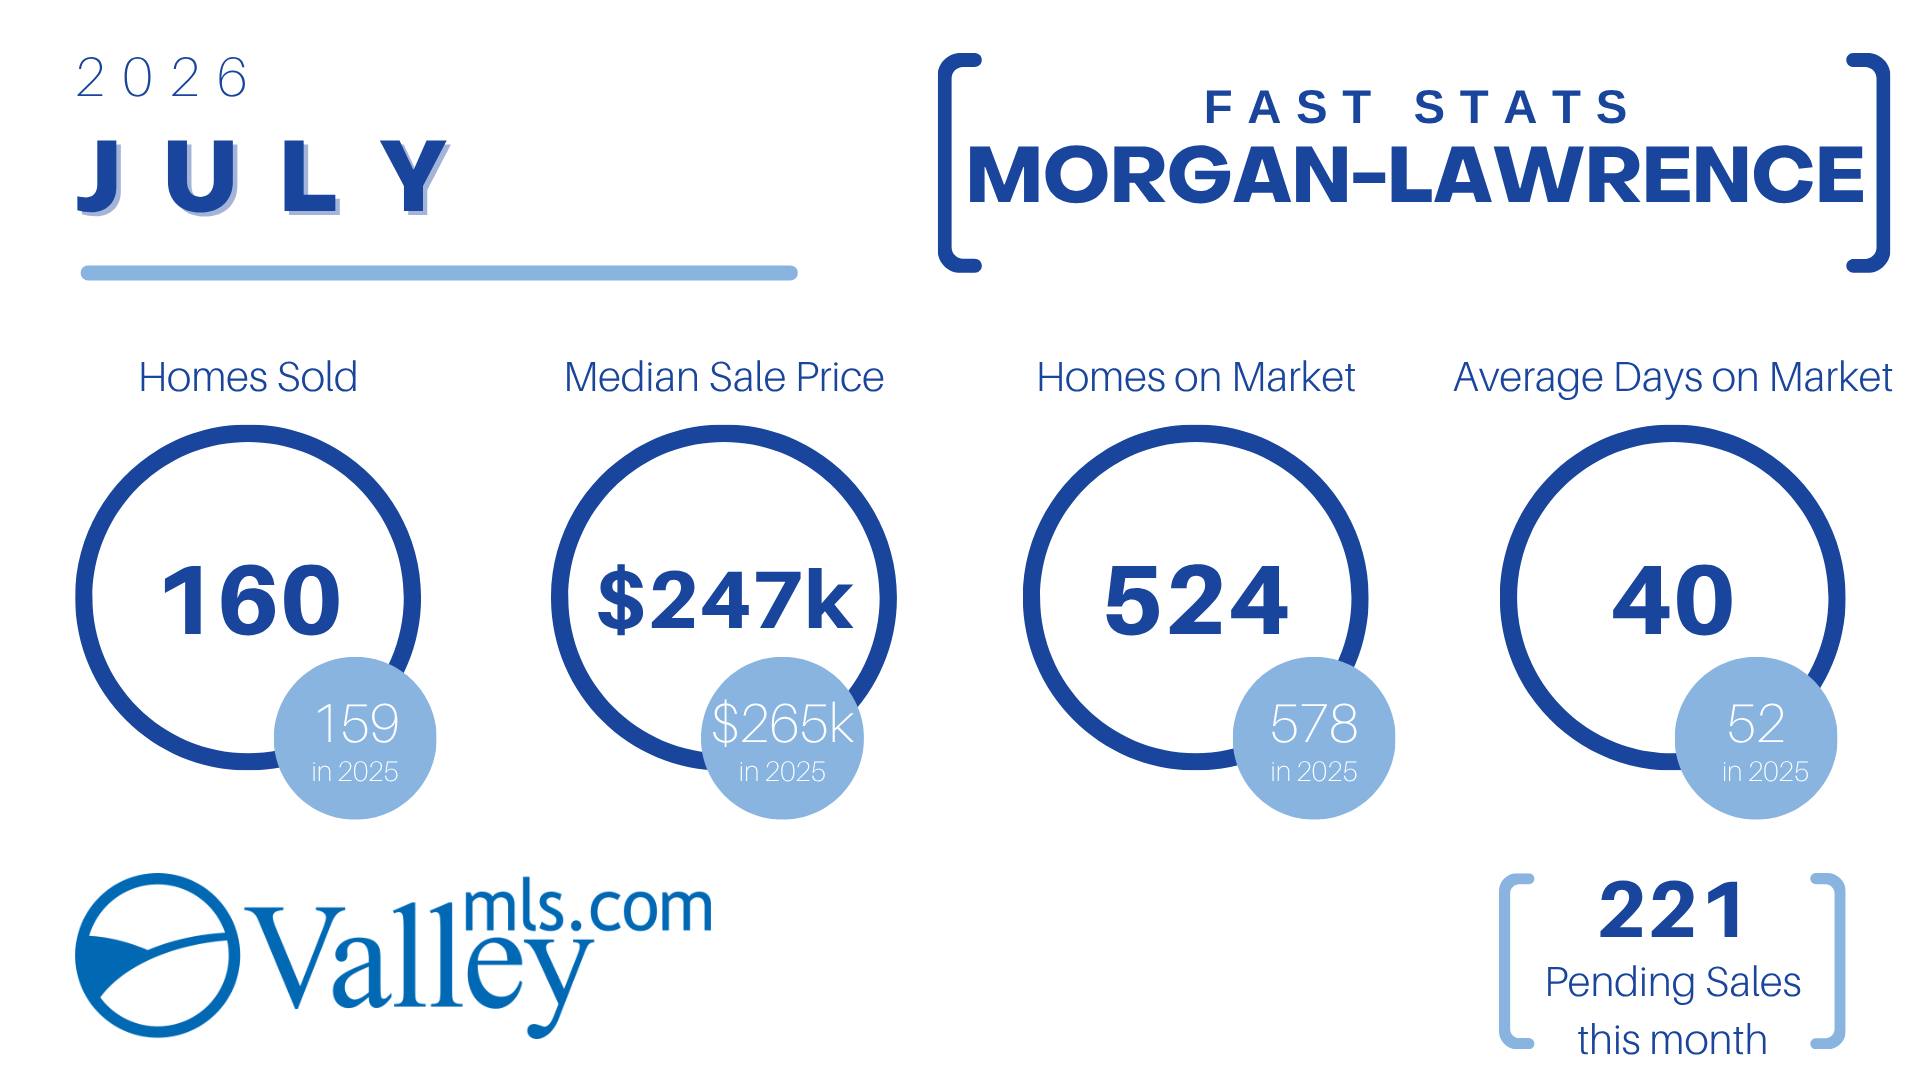
Morgan & Lawrence Counties

Morgan-Lawrence saw a significant contraction in DOM alongside steady unit sales.

  • Homes Sold: 160 (vs. 159 in 2025)

  • Median Sale Price: $247,000 (vs. $265,000 in 2025)

  • Active Listings: 524 (vs. 578 in 2025)

  • Avg. Days on Market: 40 days (Down from 52 days in 2025)

  • Pending Sales: 221

💡 How to Leverage These Stats for Your Real Estate Business

  • Pricing Strategy: Highlight price growth in Madison, Marshall, Jackson, and DeKalb counties when advising sellers on competitive listing strategies.
  • Buyer Expectations: Use increased Days on Market in regions like Etowah-Cherokee and Marshall to negotiate contingencies or price adjustments for buyers.
  • Pipeline Management: With 2,158 pending sales across the combined market, fall closing queues remain robust—ensure buyer pre-approvals and closing timelines are dialed in.
  • Use the North Alabama real estate market update and other resources from HAAR.realtor to inform yourself and your clients!

ValleyMLS.com Market Stats include statistics from the following cities/counties: Athens, Limestone County, Dekalb County, Etowah County, Cherokee County, Huntsville, Madison County, Jackson County, Marshall County, Morgan County, Lawrence County

Read More

Decoding the Latest Valley MLS Madison Market Report: What Realtors Need to Know

08/10/2026

As a real estate professional navigating the North Alabama market, staying ahead of local statistical trends isn’t just helpful—it’s essential for positioning yourself as the go-to neighborhood authority.
The latest Valley MLS Weekly & Monthly Market Area (WMA) Report for Madison, AL provides critical insights into how our local market is shifting as we navigate the late summer season. Whether you’re helping sellers set competitive listing prices or guiding buyers through offer strategies, here is a tactical breakdown of what the numbers mean for your day-to-day real estate business.

Market Overview: A Return to Equilibrium

The Madison market continues to transition into a more balanced environment compared to the rapid surges of recent years. While buyer demand remains grounded thanks to local job creation in the aerospace, defense, and technology sectors, inventory stabilization is giving buyers more breathing room.
  • Median Sale Price: Prices continue to reflect resilient baseline demand across Madison County, with premium submarkets in Madison (35756 / 35758) holding firm near high-water marks.
  • Days on Market (DOM): The average days on market has settled into a predictable rhythm (averaging 50–65 days depending on submarket and price band). Homes priced accurately from Day 1 continue to move fast, while mispriced listings stall out and require cuts.
  • List-to-Sale Ratio: Close to half of recently closed transactions settled slightly below asking price, while top-tier, move-in-ready properties still command multiple offers.

Key Takeaways for Listing Agents

Sellers are still reading headlines from peak market booms and may hold unrealistic expectations about time on market or top-dollar premiums. Your job is to align seller expectations with current MLS realities.

Strategic Advice for Your Sellers:

  • Pricing is Your Primary Marketing Tool: Overpricing in a 4+ month supply environment leads to extended DOM and larger eventual price reductions. Use the latest Valley MLS WMA hyper-local comps to justify initial launch pricing.

  • Condition & Staging Matter Again: Buyers are no longer willing to look past major deferred maintenance at premium prices. Emphasize home prep, professional photography, and minor cosmetic touch-ups before going live.

  • Negotiation Terms: Sellers should be prepared for requests involving closing cost assistance, rate buydowns, or home warranty concessions during inspection periods.

Key Takeaways for Buyer’s Agents

For buyers who felt priced out or overwhelmed by bidding wars in previous cycles, current conditions present genuine opportunities—provided they enter the market with a targeted approach.

Strategic Advice for Your Buyers:

  • Leverage Strategy Over Rush: With average DOM normalizing, buyers have time to execute thorough inspections and negotiate contingency terms.
  • Target Aged Listings: Listings that have exceeded 30–45 days on market represent prime negotiation targets for price adjustments, seller credits, or temporary interest rate buydowns.
  • School & Commute Drivers: Madison’s top-tier school district and proximity to Redstone Arsenal remain key demand drivers, ensuring long-term equity stability for purchasers in these pockets.

Final Thoughts: Position Yourself as the Local Market Expert

Data without context is just numbers on a PDF. By taking these ValleyMLS figures and translating them into actionable advice for your clients, you establish trust, set realistic expectations, and close more transactions smoothly.

Read More

Q2 Econ Report: Double-Digit Sales Growth and Steady Appreciation

07/22/2026

The Huntsville Area Association of REALTORS® has released the Q2 2026 Madison County Residential Real Estate Report, featuring deep-dive analysis conducted by the University of Alabama in Huntsville (UAH) Center for Management & Economic Research.
Despite elevated mortgage rates averaging 6.41% during the quarter, the North Alabama housing market showed impressive resilience, posting double-digit gains in sales volume and sustained price appreciation.

🚨 Key Takeaways for REALTORS®

  • Sales Surge: 2,271 homes sold in Q2 2026—an 11.3% increase year-over-year. Total sales exceeded both the 3-year (+8%) and 5-year (+6%) second-quarter historical averages.
  • Price Growth: The median sales price rose to $345,000 (up 1.8% from Q2 2025). Home price growth grew more slowly than overall inflation (3.5% in June), indicating steady, healthy appreciation.
  • Strong Demand Pipeline: Pending sales ended the quarter at 622 units, up 76.2% compared to Q2 2025.
  • New Construction Driver: 30% of all transactions (688 homes) were new construction builds.
  • Luxury Market Boom: While sales grew across most price bands, the over $800k category saw a massive ~48% increase year-over-year.
  • Balanced Inventory: Total inventory ended at 2,706 homes (down slightly by 1%), putting months of supply at 3.4 months—reflecting a stable environment as properties average 47 days on market

💼 What This Means for Your Clients & Strategy

  • For Buyers: Although mortgage rates present affordability challenges, inventory remains relatively steady (3.4 months), and 43% of homes closed below original list price—giving buyers negotiating leverage in key price bands.
  • For Sellers: High buyer demand is building in the pipeline, with June ending on a strong note. Properties priced competitively continue to sell steadily, with 18% closing above list price.
Get the complete breakdown on financing trends, price band dynamics, and local economic drivers (including Madison County GDP and population data) to share with your clients.
Read More

June 2026 Fast Stats

07/15/2026

Welcome to the June 2026 Fast Stats report! Summer is in full swing, bringing a dynamic wave of activity across our regional housing markets. Across the Combined Market, we saw a surge in home sales, climbing to 1,525 homes sold compared to 1,256 in June 2025. Meanwhile, regional inventory stayed competitive, keeping buyers and sellers highly engaged.

📊 Market Breakdown by County

🔹 Huntsville & Madison County

The Huntsville powerhouse continues to accelerate, showing a remarkable jump in activity from last summer.

  • Homes Sold: 824 (up from 635 in June 2025)

  • Median Sale Price: $348k (up from $345k in June 2025)

  • Homes on Market: 2,706

  • Average Days on Market: 42 days

  • Pending Sales This Month: 1,201

🔹 Athens-Limestone

Strong buyer demand drove higher volume in the Athens-Limestone area this month.

  • Homes Sold: 236 (up from 183 in June 2025)

  • Median Sale Price: $327k (up from $322k in June 2025)

  • Homes on Market: 1,052

  • Average Days on Market: 51 days

  • Pending Sales This Month: 435

🔹 Morgan-Lawrence

Prices dipped slightly year-over-year, but home sales held solid and inventory tightened up.

  • Homes Sold: 163 (up from 159 in June 2025)

  • Median Sale Price: $260k (down from $265k in June 2025)

  • Homes on Market: 476 (down from 578 in June 2025)

  • Average Days on Market: 50 days

  • Pending Sales This Month: 225

🔹 Marshall County

Volume remained perfectly stable year-over-year, while homes commanded slightly higher prices.

  • Homes Sold: 100 (identical to 100 in June 2025)

  • Median Sale Price: $280k (up from $273k in June 2025)

  • Homes on Market: 515

  • Average Days on Market: 49 days

  • Pending Sales This Month: 148

🔹 Etowah-Cherokee

Activity picked up pace as homes moved quicker off the market compared to the regional average drop.

  • Homes Sold: 107 (up from 93 in June 2025)

  • Median Sale Price: $240k (down from $246k in June 2025)

  • Homes on Market: 430

  • Average Days on Market: 62 days

  • Pending Sales This Month: 129

🔹 DeKalb County

DeKalb saw steady transaction growth, but the market experienced a noticeably longer closing pace.

  • Homes Sold: 43 (up from 40 in June 2025)

  • Median Sale Price: $235k (down from $246k in June 2025)

  • Homes on Market: 208

  • Average Days on Market: 67 days (up from 43 in June 2025)

  • Pending Sales This Month: 46

🔹 Jackson County

A sharp decline in median price paired with a prolonged timeline for average days on market points to a unique window of opportunity for buyers looking to negotiate.

  • Homes Sold: 24 (up from 21 in June 2025)

  • Median Sale Price: $230k (down from $287k in June 2025)

  • Homes on Market: 143

  • Average Days on Market: 115 days (up from 65 in June 2025)

  • Pending Sales This Month: 42

💡 What This Means For Buyers & Sellers

  • For Buyers: Areas like Jackson, DeKalb, and Etowah-Cherokee are seeing softer median prices or longer days on market compared to last year. This gives you extra room to breathe and negotiate.

  • For Sellers: In fast-moving metros like Huntsville/Madison County and Athens-Limestone, properties are still turning over quickly (around 42-51 days) with a solid backlog of pending sales waiting in the wings.

ValleyMLS.com Market Stats include statistics from the following cities/counties: Athens, Limestone County, Dekalb County, Etowah County, Cherokee County, Huntsville, Madison County, Jackson County, Marshall County, Morgan County, Lawrence County

Read More

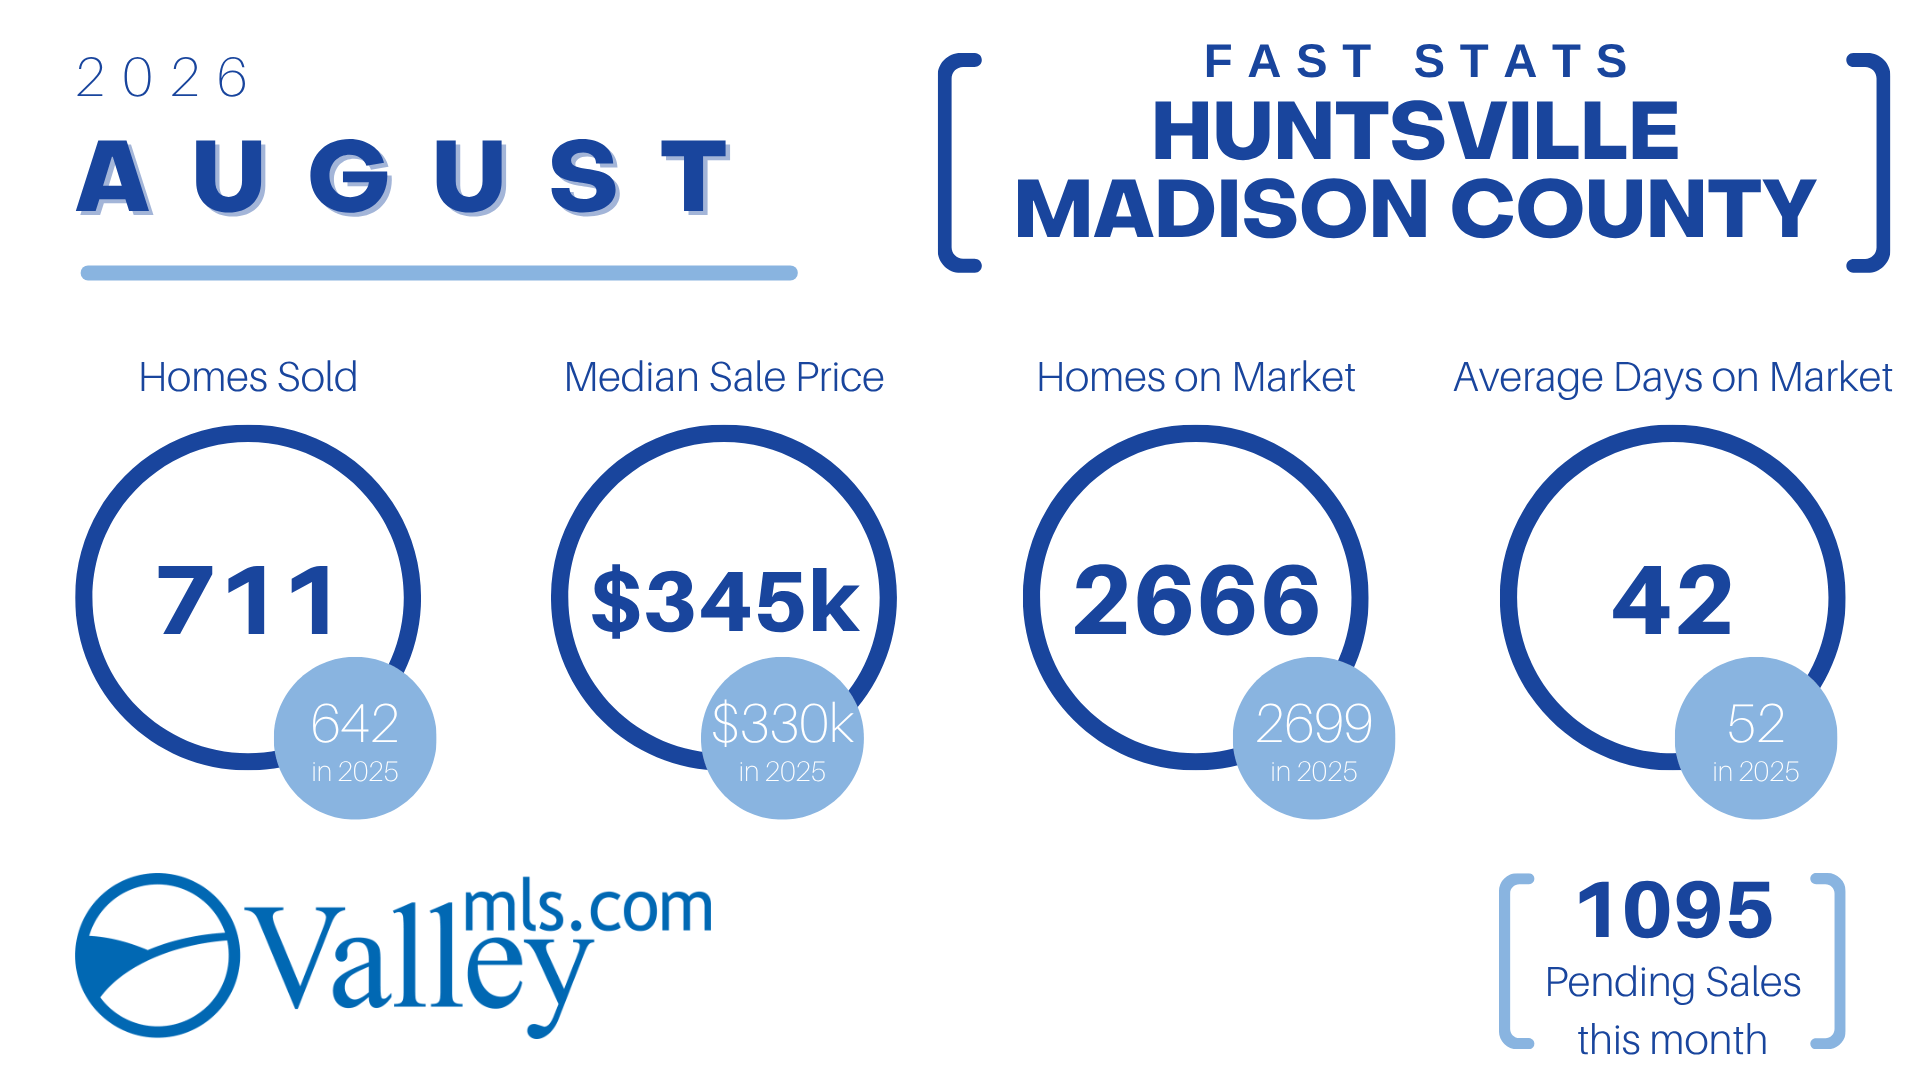
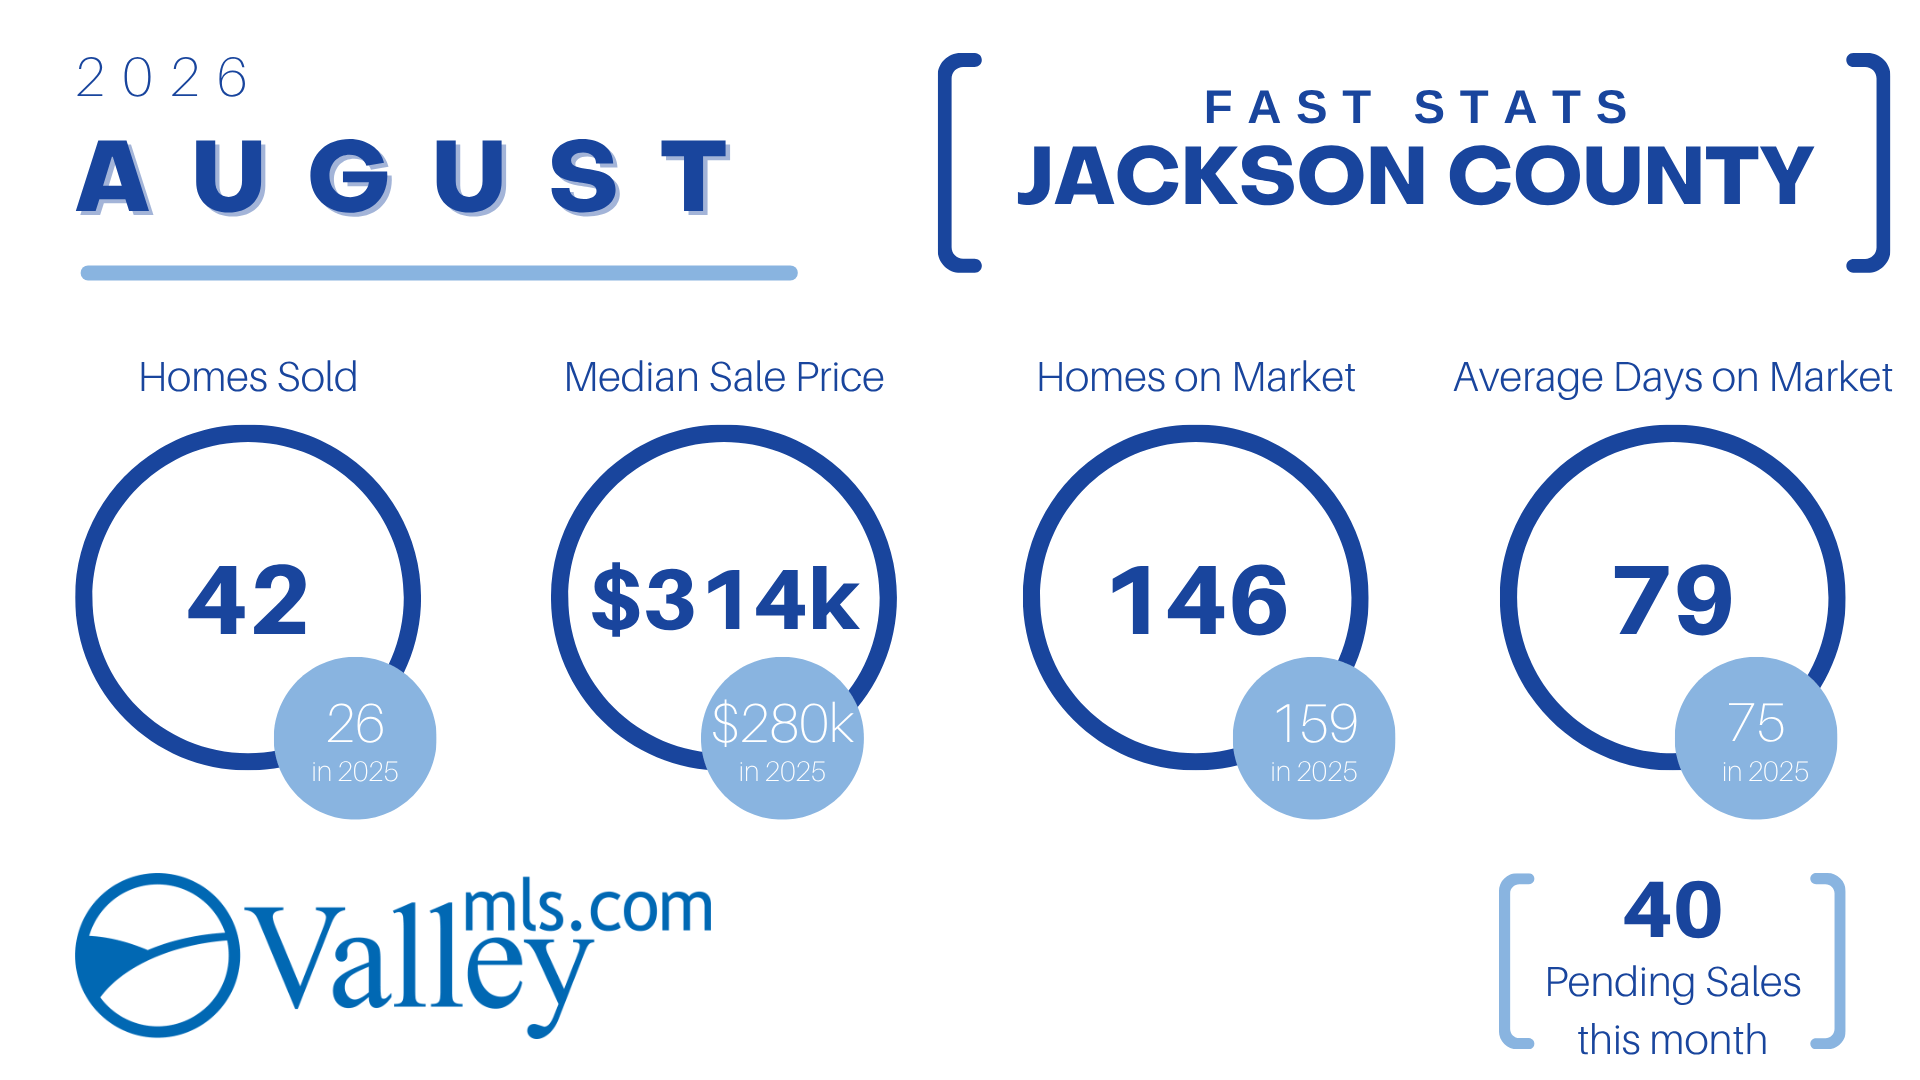
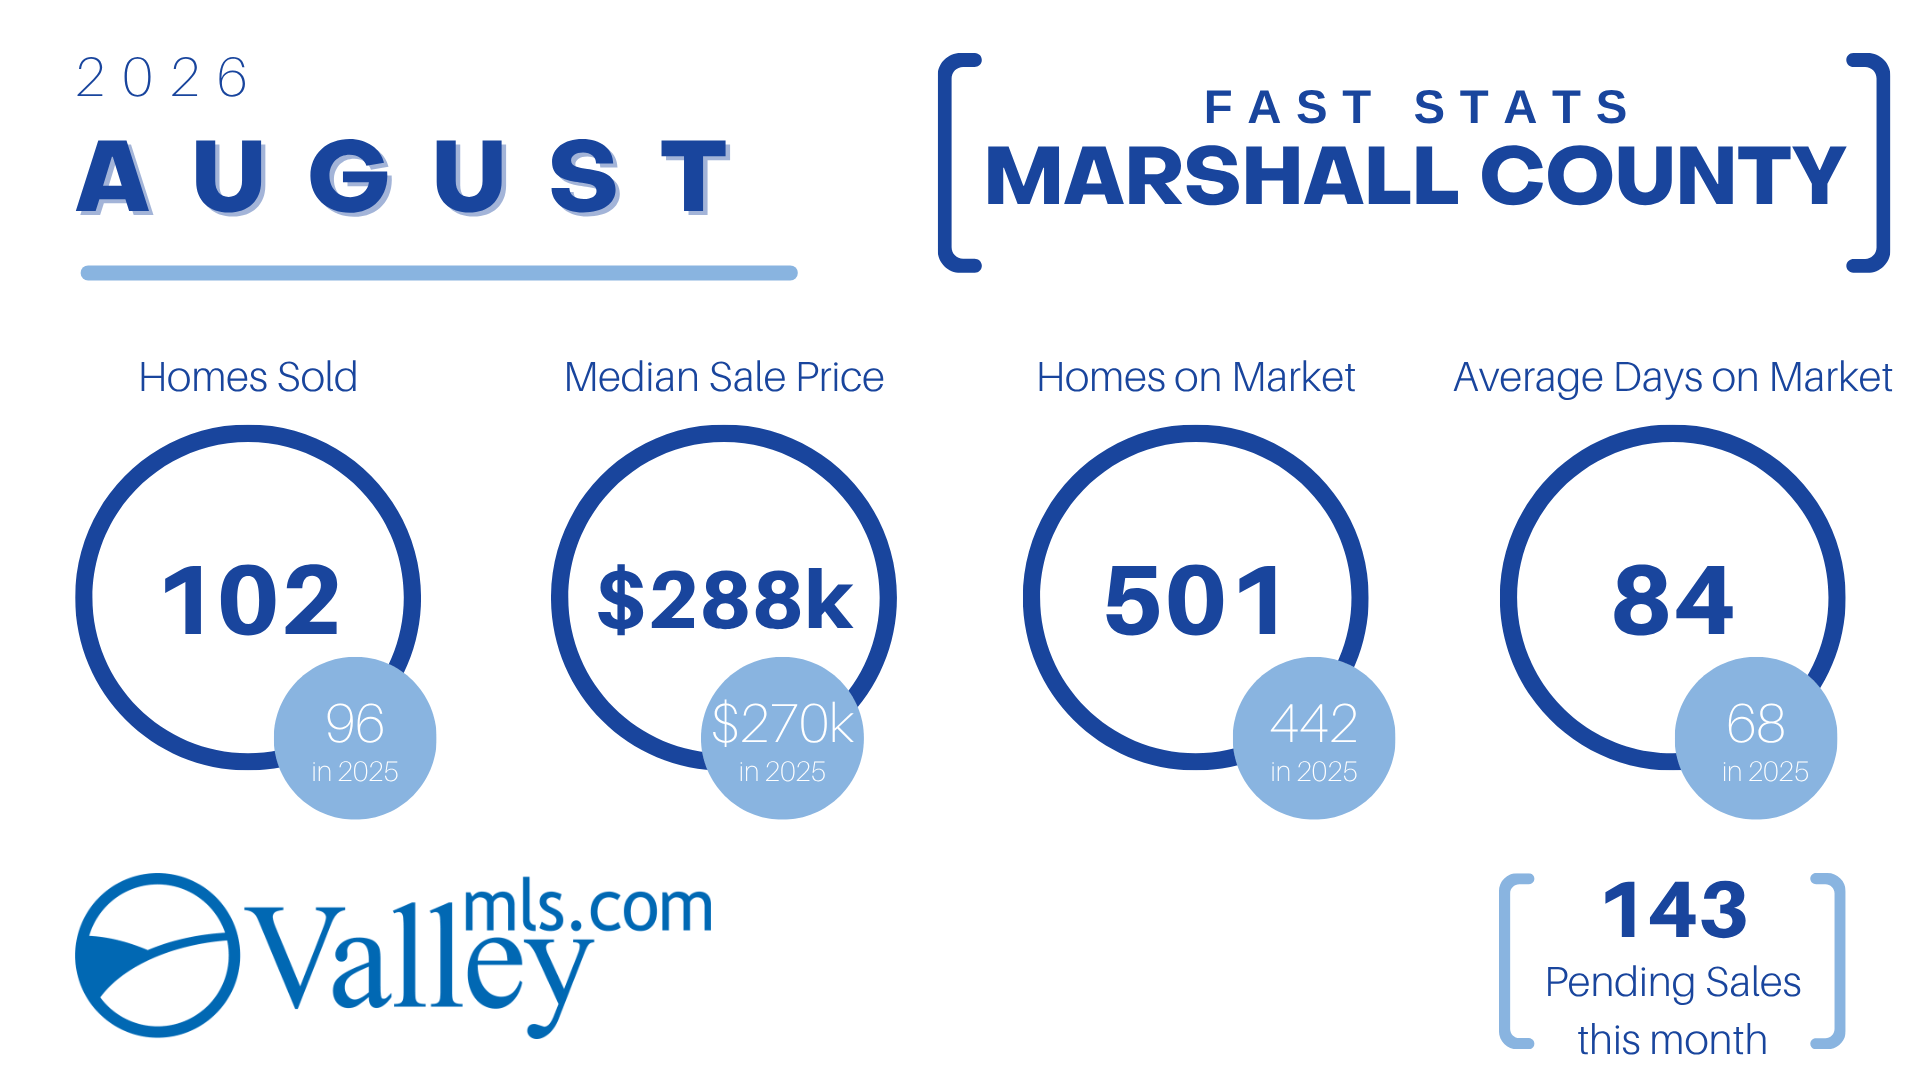
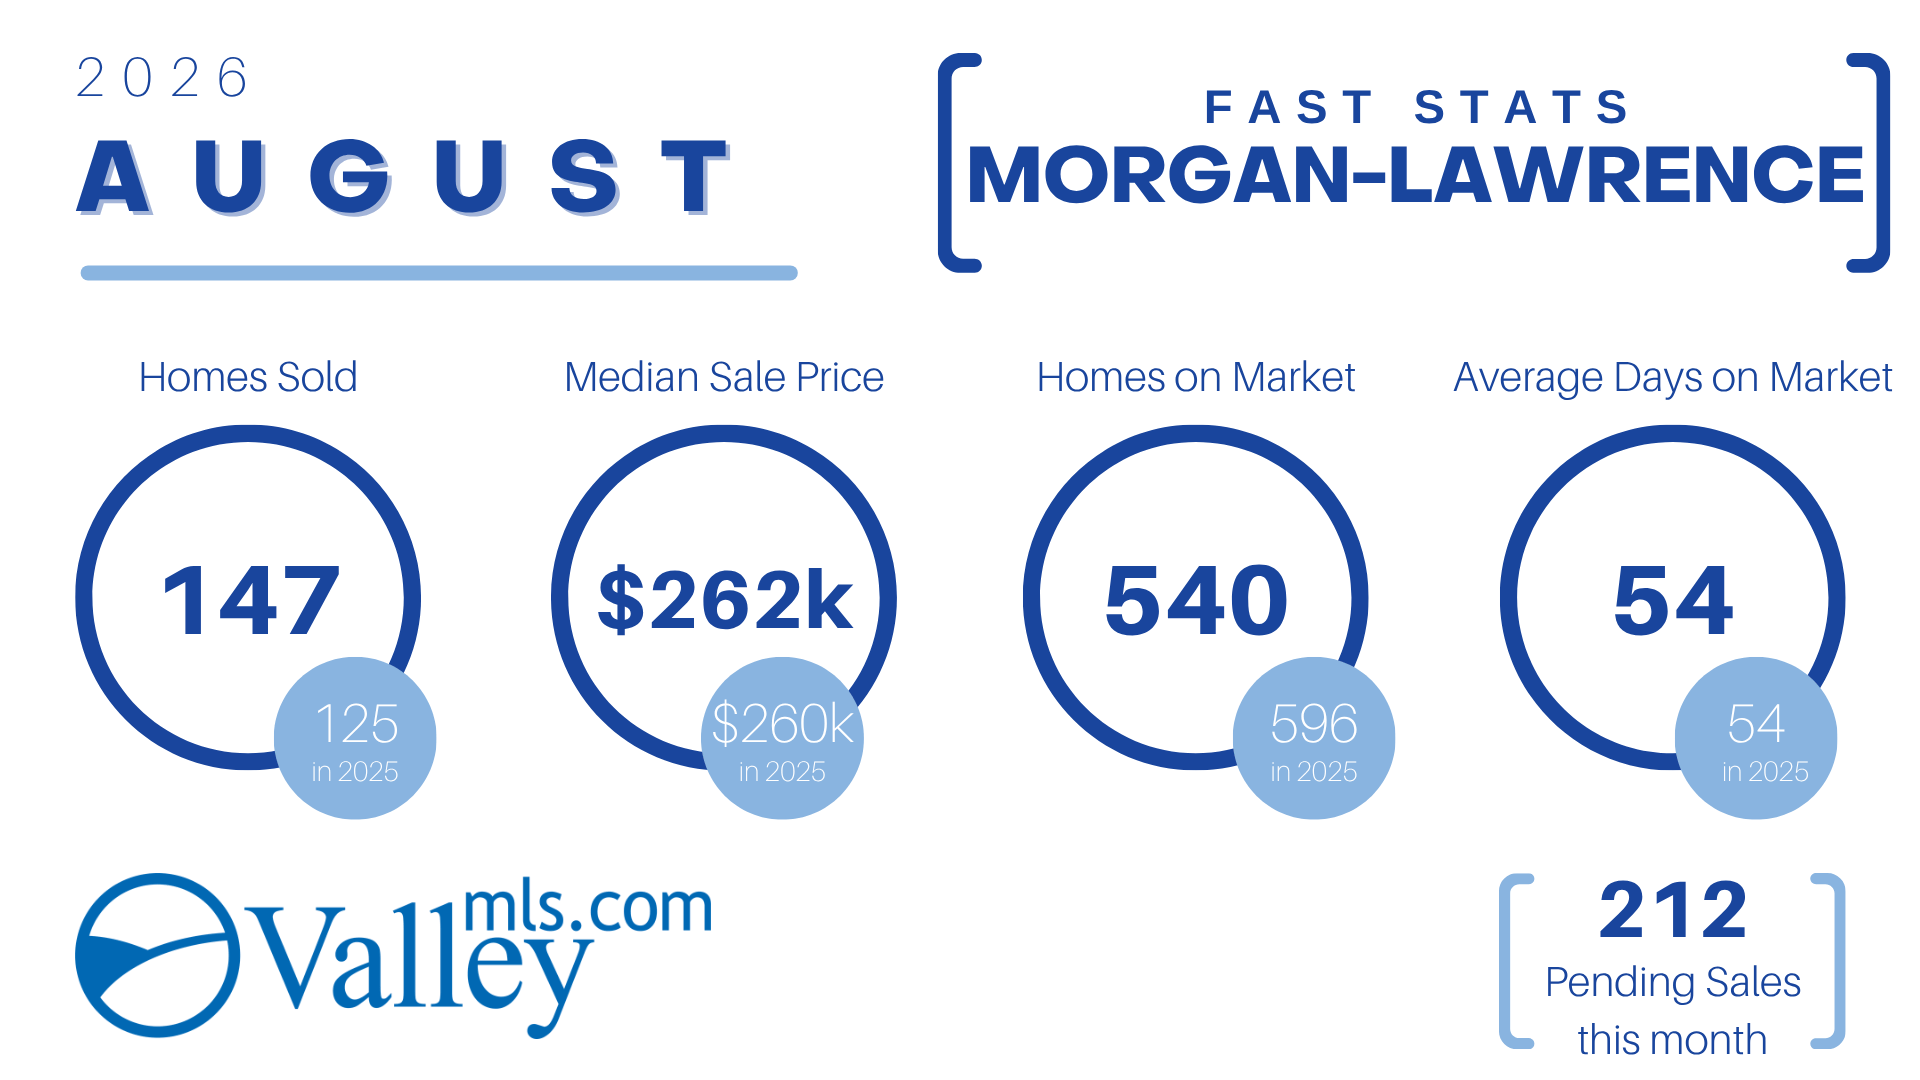
May 2026 Fast Stats

06/15/2026

The North Alabama real estate market delivered a strong performance in May 2026, characterized by rising median prices and steady demand across almost all local submarkets.

Below is our comprehensive breakdown of the latest market insights provided by ValleyMLS.

The Big Picture: Combined Market Overview

As detailed in our combined report, market-wide fundamentals remain incredibly healthy heading into the busy summer season:

  • Homes Sold: 1,453 (Up from 1,429 in May 2025)

  • Median Sale Price: $315,000 (Up from $300,000 in May 2025)

  • Active Inventory: 5,611 homes on the market

  • Average Days on Market: 54 days

  • Pending Sales Volume: A strong 2,267 pending sales pipeline

ValleyMLS.com Market Stats include statistics from the following cities/counties: Athens, Limestone County, Dekalb County, Etowah County, Cherokee County, Huntsville, Madison County, Jackson County, Marshall County, Morgan County, Lawrence County

Read More

March 2026 Fast Stats

04/22/2026

The spring market in North Alabama is officially in full bloom! March 2026 saw a steady climb in activity across the Valley, with 1,221 homes sold—outpacing last year’s performance.
Across our combined markets, the Median Sale Price has stabilized at $300k, showing a slight edge over March 2025. While inventory remains healthy with 5,251 homes on the market, buyers are moving quickly; the average home is staying on the market for 67 days.

Regional Highlights at a Glance:

  • Huntsville/Madison County: Continues to lead the charge in volume with 646 homes sold and a median price of $339k.
  • Athens-Limestone: Saw a significant jump in value, with the median sale price reaching $343k, up from $310k last year.
  • Morgan-Lawrence: Showed strong growth in sales volume, hitting 140 homes sold compared to 109 in 2025.
  • Pending Momentum: With 2,125 pending sales currently in the pipeline, we expect a busy April.

ValleyMLS.com Market Stats include statistics from the following cities/counties: Athens, Limestone County, Dekalb County, Etowah County, Cherokee County, Huntsville, Madison County, Jackson County, Marshall County, Morgan County, Lawrence County

Read More

February 2026 Fast Stats

03/15/2026

ValleyMLS.com Market Stats include statistics from the following cities/counties: Athens, Limestone County, Dekalb County, Etowah County, Cherokee County, Huntsville, Madison County, Jackson County, Marshall County, Morgan County, Lawrence County

Read More

January 2026 Fast Stats

02/16/2026

ValleyMLS.com Market Stats include statistics from the following cities/counties: Athens, Limestone County, Dekalb County, Etowah County, Cherokee County, Huntsville, Madison County, Jackson County, Marshall County, Morgan County, Lawrence County

Read More