Market Still Thriving During Pandemic in 2nd Quarter
Posted on 07/23/2020
If you would like your company’s branding placed on this report to distribute to your clients or colleagues, please email Daniela Perallon your request with a high resolution logo at Daniela@valleymls.com.
The local housing market continues to avoid most negative consequences of the COVID-19 economic downturn when compared to other sectors of the Madison County economy.
Gross Domestic Product, the sum of all goods and services produced in the region, for the Huntsville metro area has increased 26% since 2011.
This quarter saw a significant increase in the median sales price at $248,680.
Days on Market dropped to another record low of 29 days, compared to 45 days this time last year.
Listings remain low, but there was an increase of 295 from the first three months of 2020.
Considering the inventory levels by price range and the significant slowdown of the economy in the second quarter due to the pandemic, the continuing rise in sales prices is surprising. The industrial growth in the local area as well as the large percentage of government employment are significant contributors to the housing demand in addition to the relatively low numbers of available homes.
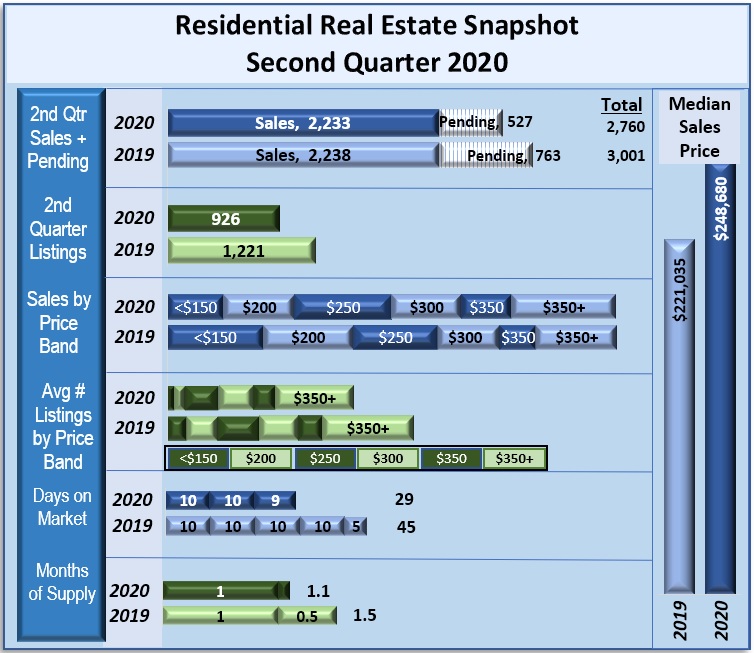
Second Quarter 2020 metrics include:
Sales: Remained high at 2,233 with 527 sales pending compared to 2,238 sales and 763 pending in 2019.
Median Sales Price: Rose to $248.680 compared with $221,035 in 2019.
Inventory: Was 24% lower at 926 homes compared to the same quarter in 2019, but the average number of listings rose 26% from last quarter.
Days on Market: Dropped to another record low of 29 days compared to 45 days in 2019
Months of Supply: Fell to 1.1 months from the 2019 first quarter low of 1.5 months.
Figure 1
Sales Price Band:
Less than $150,000 sales fell to 279 (-41%) sales compared to 474 in 2019
$150,000-$200,000 sales fell to 354 (-21%) sales compared to 451 in 2019
$200,000-$250,000 sales rose to 482 (15%) sales compared to 419 in 2019
$250,000-$300,000 sales rose to 349 (12%) compared to 312 in 2019
$300,000-$350,000 sales rose to 248 (389%) compared to 179 in 2019
Over $350,000 sales rose to 521 (29%) compared to 403 in 2019
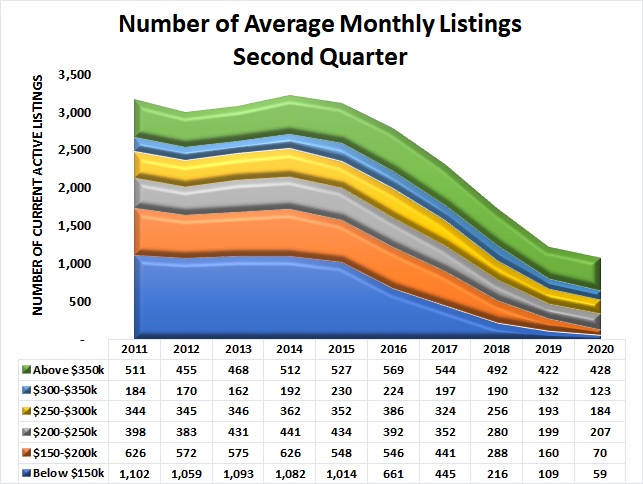
Inventory Price Band:
Less than $150,000 fell to 59 homes vs. 109 in 2019
$150,000-$200,000 fell to 70 homes vs. 160 in 2019
$200,000-$250,000 rose to 207 homes vs. 197 in 2019
$250,000-$300,000 fell to 184 homes vs. 193 in 2019
$300,000-$350,000 fell to 123 homes vs. 132 in 2019
Over $350,000 rose to 428 homes vs. 422 in 2019
Homes Sold
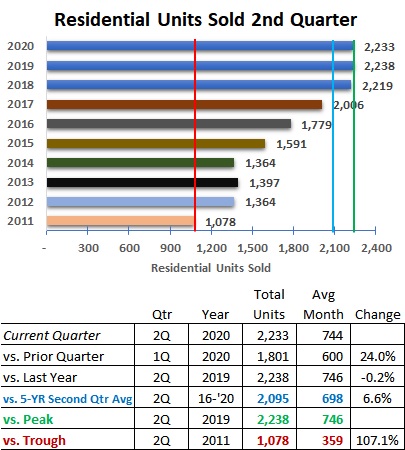
ales continued at record levels in the second quarter. The total units sold 2,233 this year is about the same as the 2,238 in the second quarter 2019. See Figure 2.
The five-year average second quarter total sales increased to 2,095.
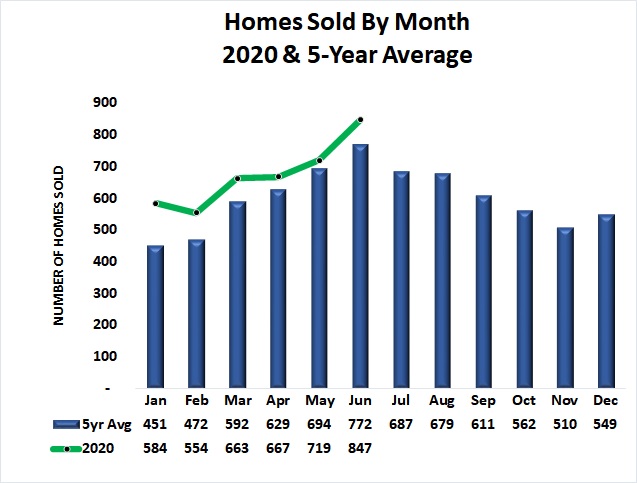
Homes Sold by Month
Comparing homes sold to the five-year monthly average shows that sales in 2020 continues at higher than normal levels through June. June’s actual sales of 847 was 10% above the five-year average June sales level. May’s actual sales of 719 was 4% above the May average of 694. April sales (667) was 6% above the five-year average.
Figure 2
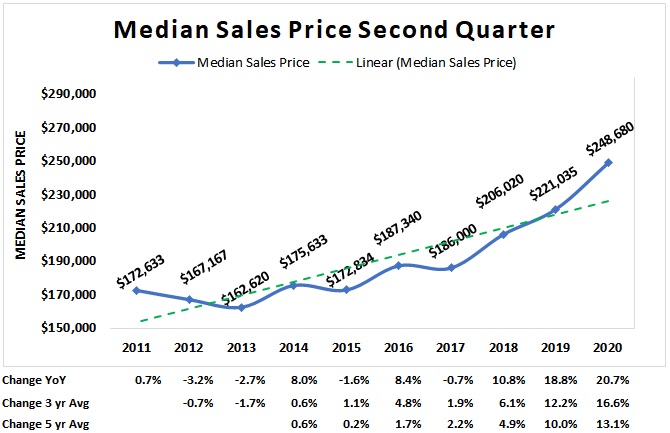
Median Sales Price
The rate at which prices are increasing appear to be accelerating -rising month-to-month as well in the second quarter of each year. The median sales price for the second quarter 2020 was $248,680, 12% higher than at the same quarter in 2019.
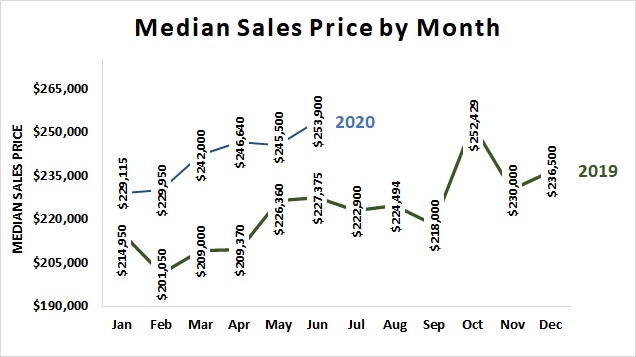
The overall price trend is higher since 2017 as shown in Figure 4. Figure 5 shows the median sales price by month for 2019 and 2020. All 2020 months have higher price levels than 2019.
Figure 3
Figure 4
Figure 5
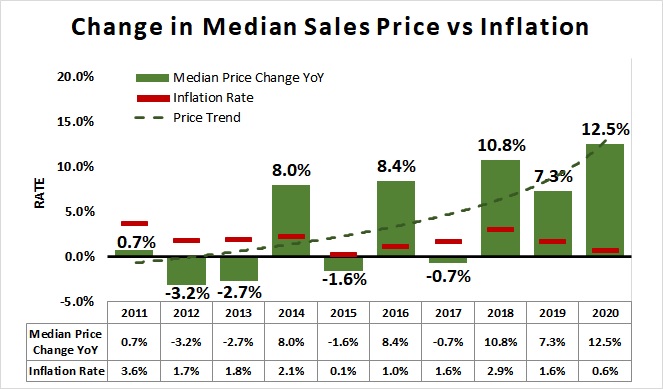
Home prices continue to rise much faster year over year than other costs in the local economy represented by the inflation rate for all goods in Figure 6. The economic slowdown in the second quarter compares the rate of change in the median sales price of homes (green columns) with the inflation rate (red lines) and the home price trend line (green dotted line).
Figure 6
Figure 7
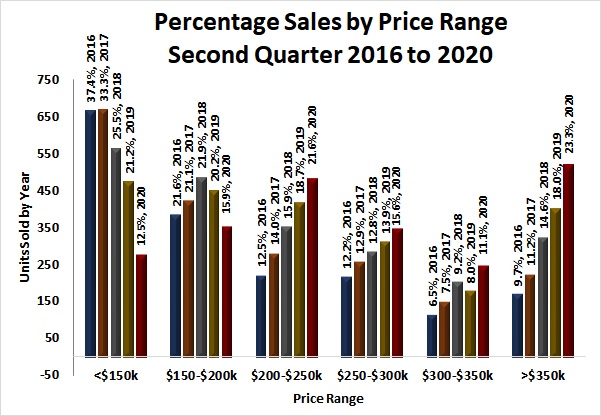
Sales Price by Range
The greatest number of homes sold (521) in the quarter was in the above $350,000 price range. Sales of homes priced below $200,000 dropped in the second quarter while the number of sales in the four higher-priced sales ranges rose 15%, 12%, 38%, and 29% respectively. The number of sales in the under $150,000 range, dropped dramatically (-41%) from the 2019 second quarter. This compares to the 16% drop of sales in this range in 2019. The greatest increase (39%) in sales occurred in the $300-$350,000 range. See Figure 7.
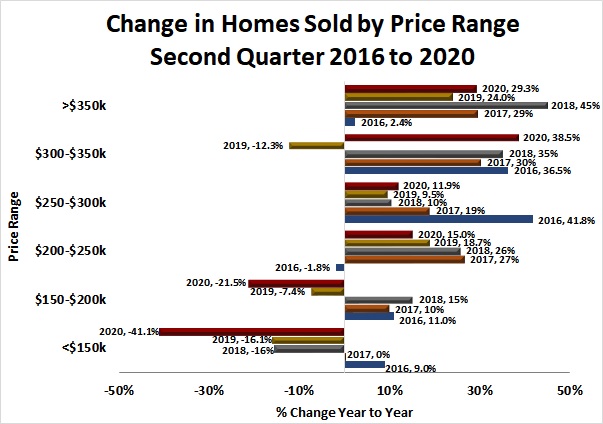
Quarter over quarter comparisons (Figure 8) shows the change in second quarter sales by year since 2016. Drops in the percentage of homes sold in the under-$150,000 and $150-$200,000 ranges were more than offset by increases in the four ranges above $200,000.
Considering the inventory levels by price range and the significant slowdown of the economy in the second quarter due to the pandemic, the continuing rise in sales prices is surprising. The industrial growth in the local area as well as the large percentage of government employment are significant contributors to the housing demand in addition to the relatively low numbers of available homes.
Figure 8
Figure 9
Inventory
The average number of homes listed for sale continued to decline in second quarter but rose 26% from the first quarter 2020 level. Only an average of 129 homes priced below $200,000 were listed in the second quarter 2020. The greatest number of homes listed for sale was in the above-$350,000 price range at 428. The $200,000-$250,000 price range had the second most with 207 homes listed. See Figure 9.
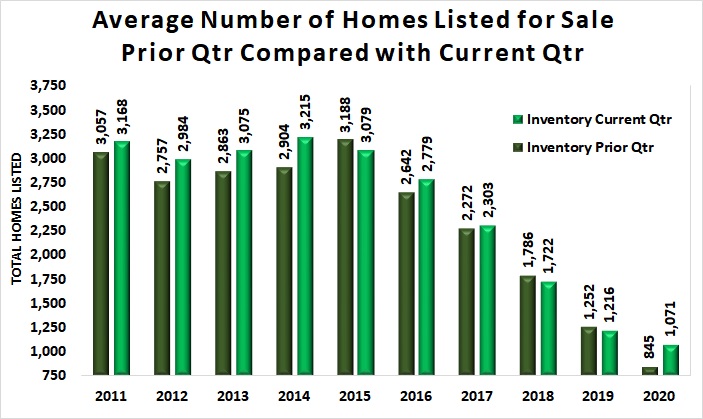
Comparing the inventory of homes quarter-to-prior-quarter there is a continuous drop in the number of homes available since 2015. However, the average number of homes available month-to-month rose this quarter for the first time since 2017. There were only 926 homes available at the end of June 2020 compared to 877 at the end of March. See Figure 10.
Figure 10
Figure 11
Months of Supply
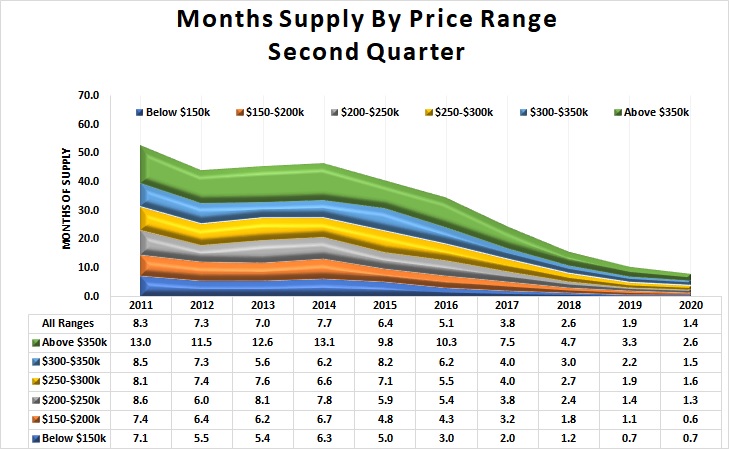
The months-of-supply of homes on average for the second quarter 2020 overall was 1.4 months but only 0.6 months for homes priced between
$150,000 and $200,000 at the second quarter level of sales. Homes priced below $150,000 was only slightly longer at 0.7 months. All price bands saw a reduction in the months-of-supply compared to the same period in 2019.
Months-of-Supply for homes priced above-$350,000 dropped to 2.6 months- of-supply from the 3.3 months one year ago. The longest months-of-supply for all homes in the decade occurred in 2011 at 8.3 months. See Figure 11.
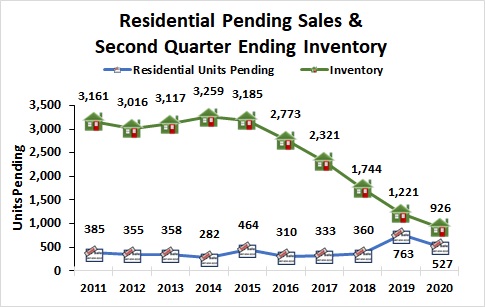
he number of pending sales and the available inventory at the end of the quarter continued to fall. There were 926 homes listed at the end of the second quarter 2020 while there were 527 home sales pending for a total of only 1,453 homes “not sold” in Madison County. There was a reduction in the number of pending sales to 527 from June 2019 and the lowest level since December 2019. See Figure 12.
Days on Market
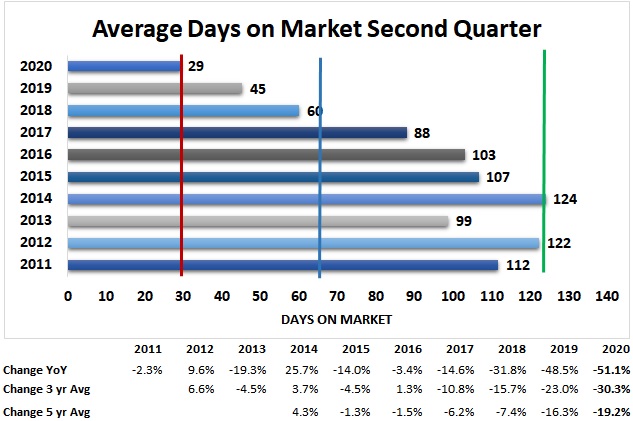
The average number of days-on-market (DOM) dropped to a record low level 29 days in the second quarter of 2020. The reduction from the peak quarter average in 2014 of 124 days (green line) has been continuous with a reduction occurring in the second quarter of each year. The five- year average days-on-market (blue vertical line) is 65 days. See Figure 13.
Figure 12
Figure 13
Sales & Average Inventory Trends
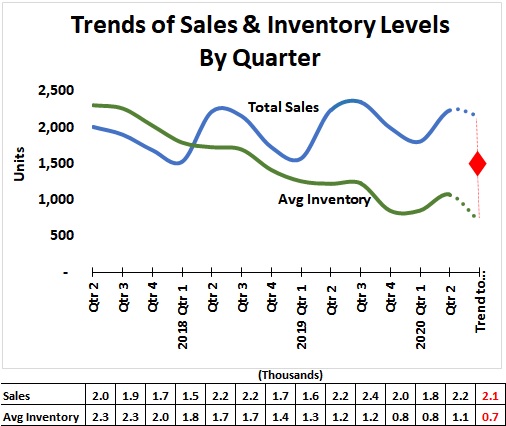
Average inventory of homes available for sale (green line in Figure 14) continues to decline while the number of units sold (blue line) continues to increase. To sustain this trend, a significant number of newly constructed homes and newly listed homes will be needed. Otherwise, prices are likely to continue to rise until demand drops. A sudden increase in mortgage rates could significantly impact demand.
Figure 14 suggests sales volume may drop in the third quarter of 2020. The number of listed homes may also decline if current trends continue. The red diamond represents the number of new listings needed to sustain the current levels into the third quarter residential real estate market. Note that the current pandemic or other shock to the economy may affect the demand for or supply of homes or both.
Real estate activity is subject to many forces including the number of people needing housing, their ability to purchase, and the confidence they have in the stability of their future income. The economy of the region represented by the area’s Gross Domestic Product (GDP) may also provide insight into the future real estate industry.
Figure 14
Madison County Population & Workforce Trends
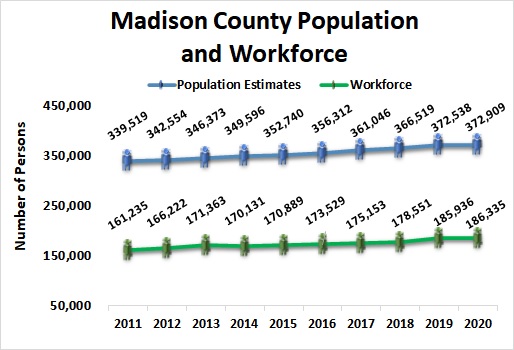
Population of Madison County as estimated by the U.S. Census Bureau has grown steadily since the 2010 census. The population in 2011 was 339,519 persons. The most recent annual estimate of Madison County’s total population shows a 10% increase to 372,909 in 2020 from 2011. See the blue line in Figure 15.
The workforce is comprised of the number of people working plus the number looking for work. The annual workforce (green line) has also risen since 2011 by 16% to reach 186,335 in 2020. Growth in the number of people with jobs likely creates new demand
for housing in the region. It is important to note that the workforce is drawn from surrounding counties so not all new members of the workforce will be seeking housing in Madison County.
Figure 15
Figure 16
Households
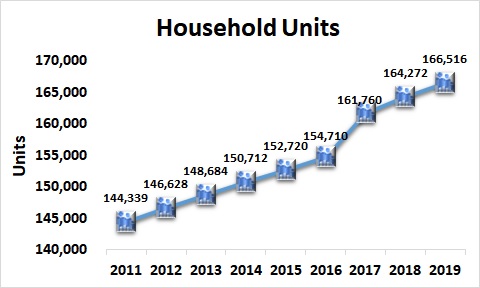
The number of households represents the number of housing units of all types needed in the area — Madison County. Households may be comprised of nuclear families, extended families, individuals living alone as well as housing for unrelated roommates. Housing units should generally move in relation to population but not always at the same rate – there may be time lag.
The number of housing units in Madison County, Alabama grew from 144,339 in 2011 to an estimated 166,516 in 2019 per the U.S. Census Bureau. This is an increase of 15% over the decade. See Figure 16.
Household Income
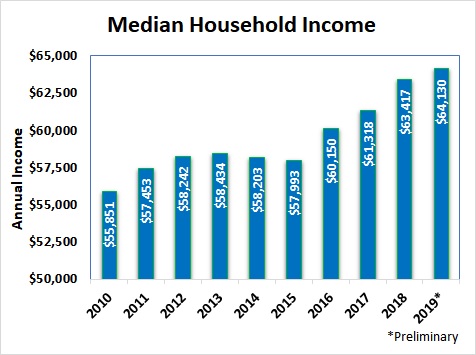
The rule of thumb for housing affordability is that housing costs should not exceed 30% of household income. So, the Annual Household Income could be used to estimate housing affordability. The estimated median annual household income for 2019 was $64,130. The Median level represents the point where one- half of the households have income above and one-half have income below the level. Overall, the Annual Median Household Income in current dollars has grown by 14.8% since 2010. See Figure 17.
Figure 17
Figure 18
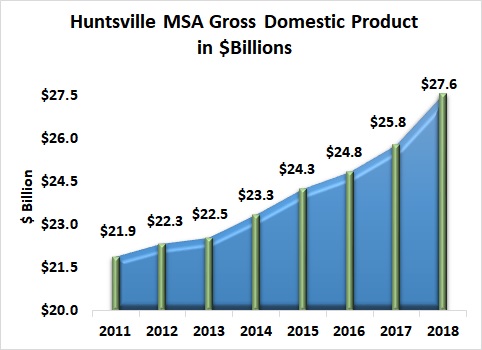
Gross Domestic Product – Huntsville Metropolitan Statistical Area
Gross Domestic Product is the sum of all goods and services produced in the region. The Huntsville Metropolitan Statistical Area is comprised of Limestone and Madison Counties, Alabama.
Gross Domestic Product for the Huntsville MSA grew to approximately $27.6 billion dollars in 2018, the most recent year data is available. This is an increase of 26% since 2011. See Figure 18.
Economic Growth Developments
The Chamber of Commerce of Huntsville/Madison County is the lead economic development organization in Madison County. Existing industry and new industry announcements may provide insight into the economic activity in the coming year. These announcements can be found at this link.