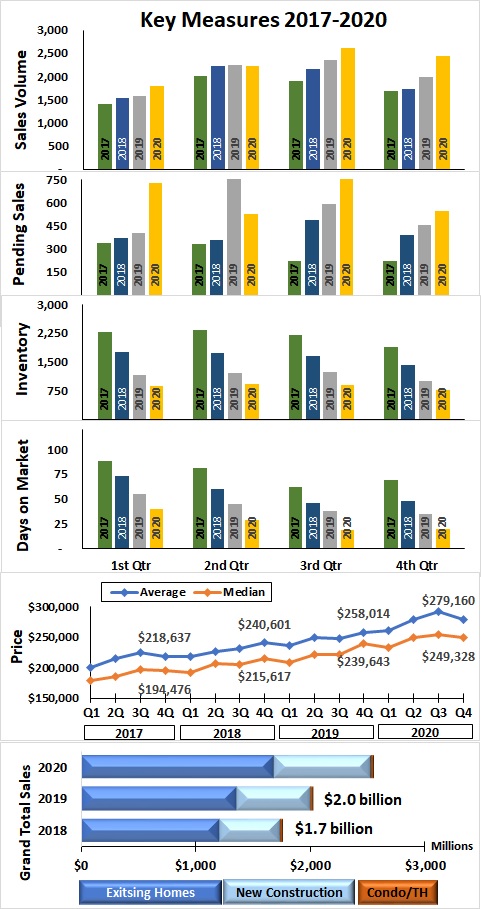
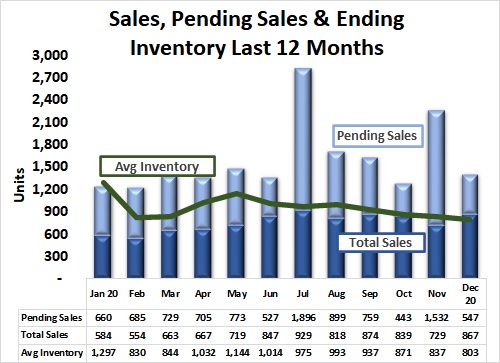
Annual Report Tells Story of Adaptive, Resilient REALTORS®

Residential real estate in Madison County continued to grow with only a slight pause in the second quarter 2020.  The Grand Total of all Sales reached $2.5 billion in 2020 and is up from $2.0 billion in 2019, a 25% increase. Existing home sales totaled $1.7 billion and new construction totaled $845 million with condos & townhomes adding $24 million.  See Figure 1.

There were 9,090 properties sold in an average 27 days-on-market (DOM) compared to 43 DOM last year.  Median sales price continued its upward trend to $249,328 in the 4th quarter which was an increase of 4% over 4th quarter 2019.   There were approximately 8,860 new listings during the year. By the end of 2020, there was only 26 days of supply.

Sales Volume

Sales volumes increased in three quarters of 2020 above the same quarters in 2019. The second quarter sales volume was comparable to the second quarter in 2019. However, significant growth occurred in 3rd quarter (12%) and 4th quarter (22%) of 2020 compared to 2019. See Figure 1.

Pending Sales

Sales pending at the end of each quarter was significantly higher in 2020 than in 2019. Pending sales at year-end totaled 547 compared to 456 in 2019.  See Figure 1.

Inventory of Homes Listed

The number of homes available continued to fall in 2020.  At year-end, there were only 764 homes listed compared to 993 at year-end 2019, a reduction of 23%.  There was a positive trend in newly constructed homes with 465 homes available at year-end, up from 440 in 2019. See Figure 1.
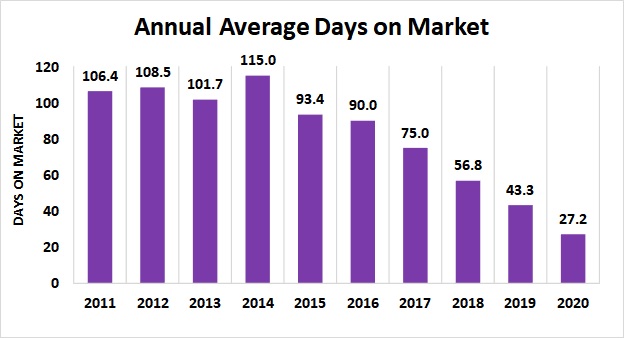
Days on Market

Average days on market in the 4th quarter of 20 days remained similar to the 19 days in the 3rd quarter.  This level is down from 35 days in the 4th quarter of 2019.   See Figure 1.
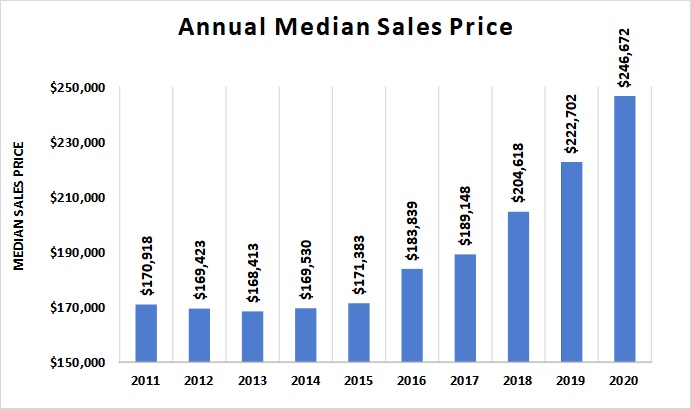
Price

The average sales price (blue line) and median sales price (gold line) grew through the 3rd quarter of 2020 to $291,953 and declined in the 4th quarter to $279,160. Median sales price reached a new high of $254,991 in the 3rd quarter and was slightly lower at $249,328 in the 4th quarter.


Units Sold

The total number of residential units sold in 2020 (9,090) increased 11.5% from 2019 and 113% from 2011. The annual number of units sold has risen each year since 2011 except for the small decline in 2014. See Figure 2.

Sales Price Levels

Sale price levels rose more in 2020 than in any year since 2011.  The annual average sales price reached $277,832 in 2020, up 12.1% from 2019.  Since 2011, average sales price has increased $82,420 from $195,412 and $84,325 from the lowest level, $193,507, of the decade in 2013. See Figure 3.

The median sales price represents the price at which about 4,545 homes were sold at a lower price in 2020 and 4,545 homes were sold at a higher price. Annual median levels rose throughout the decade, up 44% since 2011 and 46% from the low of 2013. The median price of 2020, $246,672, was 11% above the 2019 level. See Figure 4.

Average Days on Market

Number of days on market (DOM) is a measure of how long homes are on the market.  In 2020, the average days on market fell to a 27 day average for the year. The monthly average DOM was below 20 in Aug., Sep., Oct., and Dec.  A falling DOM may suggest that demand was rising, inventory of homes was falling or both in the measurement period. See Figure 5.

Sales and Inventory

Home sales for the year reached 9,090 with the peak in July. The total of sales plus pending sales by month exceeded the total number of listed homes available for sale in eleven of twelve months in 2020.  See Figure 6.  Total home sales were 2,435 for the 4th quarter and pending sales totaled 547 at the end of December.

The December ending inventory was 764 compared to 2,573 homes in 2011 was the lowest level in two decades.  


Summary

Despite the pandemic effects in 2020 slowing the local economy, residential real estate transactions continued to grow.  Strong demand met a falling supply of available homes and increasing prices during the year.  Fourth quarter sales of newly constructed homes reached a record level (726 in 2020 compared to 324 in 2011). Barring a more significant economic event or slow growth in new home construction, this momentum should positively impact the market at least in the near term.  

Data Sources:
Alabama Department of Labor
Chamber of Commerce of Huntsville/Madison County
Huntsville Area Association of Realtors Quarterly Reports U.S. Bureau of Economic Analysis
U.S. Census Bureau Valley MLS System
Analysis & Report Prepared By:
  • Jeff Thompson, Project Director
  • Brinda Mahalingam, Ph.D., Economist
Questions regarding this report should be directed to:
Jeff Thompson, jeff.thompson@uah.edu, 256.361.9065
If you would like your company’s branding placed on this report to distribute to your clients or colleagues, please email Daniela Perallon your request with a high resolution logo at Daniela@valleymls.com.