Real Estate Market Builds on Summer Success
If you would like your company’s branding placed on this report to distribute to your clients or colleagues, please email Daniela Perallon your request with a high resolution logo at Daniela@valleymls.com.
Third Quarter, 2020
Residential real estate prices continued to rise while the number of homes sold remains at record level. The median sales price for the third quarter was $254,991 compared to $221,798 for the same quarter in 2019. The total homes sold (2,621) was 271 above the 2019 level of 2,350. The average number of listings declined by a similar amount (-336) from 1,226 in 2019 to 910 in September 2020. Average Days on Market dropped to only 19 days from the 38 days in 2019.
Third Quarter 2020 metrics include:
- Sales – 2,621 sold with 759 sales pending compared to 2,250 sales and 595 pending in 2019.
- Median Sales Price – Climbed to $254,991, $33,193 above the 2019 third quarter level.
- Inventory – Number of available homes fell in every price band. The quarter totals also declined to 910 at the end of the 3rd quarter. There were 926 homes available at the end of June and 1,226 at the end of the 3rd quarter 2019.
- Days on Market– Dropped to another record low of 19 days compared to 38 days in 2019.
- Months of Supply – Fell to one month from the 1.8 months in 2019.

Sales Price Band: Less than $150,000 sales fell to 286 (-38%) sales compared to 461 in 2019
- $150,000-$200,000 sales fell to 375 (-24%) sales compared to 494 in 2019
- $200,000-$250,000 sales rose to 624 (32%) sales compared to 473 in 2019
- $250,000-$300,000 sales rose to 446 (45%) compared to 307 in 2019
- $300,000-$350,000 sales rose to 287 (21%) compared to 237 in 2019
- Over $350,000 sales rose to 603 (59%) compared to 378 in 2019
Inventory: – Less than $150,000 fell to 40 (-57%) homes vs. 91 in 2019
- $150,000-$200,000 fell to 59 (-59%) homes vs. 144 in 2019
- $200,000-$250,000 fell to 170 (-16% homes vs. 202 in 2019
- $250,000-$300,000 fell to 166 (-22%) homes vs. 213 in 2019
- $300,000-$350,000 fell to 120 (-5%) homes vs. 127 in 2019
- Over $350,000 fell to 411 (-8%) homes vs. 447 in 2019

Homes Sold
Sales climbed to another record level in the third quarter. The total units sold 2,621 this quarter was 12% higher than the 2,350 units sold in same quarter 2019 and 21% above the five-year average third quarter total sales of 2,159. See Figure 2.
Homes Sold by Month
The average number of homes sold monthly in 2020 continues to exceed the five-year (2016-2020) monthly average. September’s actual sales of 874 was 43% above the five-year average September sales level (611). August’s actual sales of 818 was 20% above the August average of 679. July sales (929) was 35% above the five-year average of 687. See Figure 3.


Median Sales Price
The overall price trend continues its rise since 2014 as shown in Figure 4. Figure 5 shows the median sales price by month for 2019 and 2020. All months in 2020 saw higher prices than 2019.
The median sales price for the quarter reached $254,991 with the monthly peak occurred in August at $263,640 (17% above 2019). September median sales price was $251,432, 15% over the 2019 level


Home prices continue to rise much faster year-over-year than other costs in the local economy represented by the inflation rate for all goods. Figure 6 shows the year-over-year median prices (green columns) increased 15% for the third quarter while the overall inflation rate (red lines) for 2020 as of August was 1.4%. The home price trend line (green dotted
Sales Price by Range
The greatest number of homes sold in the quarter was for those priced $200-$250,000, an increase of 32%. However, the greatest percentage increase (182%) was in homes priced above $800,000. Sales of homes priced below $150,000 dropped -38%, the most in the third quarter and homes priced between $150,000 and $200,000 dropped by -24%. Overall, the largest percentage increase (61%) of homes sold occurred for homes priced above $200,000 while homes priced below $200,000 fell by 40% during the quarter. See Figures 7 & 8.


Quarter over quarter comparisons shows the greatest number of homes sold (624) was in the $200,000 to $250,000 range. Homes priced $250-$300,000 was a close second at 446 homes sold followed by 424 homes priced between $350-$500,000.
The rise in the number of homes sold in price ranges above $200,000 and the drop in the number of homes sold below $200,000 since 2018 likely reflects a long-term increase in the price of homes in Madison County, Alabama. For example, third quarter sales increased in 2020 over 2019 by 50% (424 vs 283) for homes priced between $350,000 -$500,000, 113% (117 vs 55) for $500,000 -$650,000 homes, and 181% (31 vs 11) for homes priced above $850,000.
Inventory of Homes Available
The average number of homes listed for sale continues to decline. An average of only 40 homes priced below $150,000 were listed in the third quarter 2020. The greatest number of homes listed for sale was in the $350-$500,000 price range at 227. The $200,000-$250,000 price range had the second most with 170 homes listed which was down from 207 homes in the second quarter. See Figure 9.
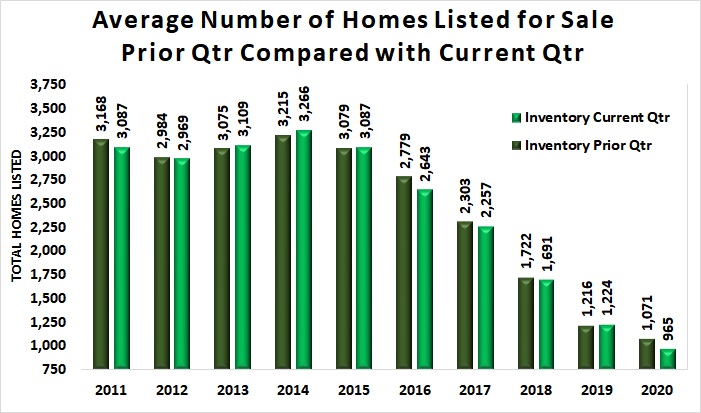
Comparing the inventory of homes quarter-to-prior-quarter shows the continuous reduction in the number of homes available since 2014. The average total number of homes available month-to-month fell by 106 this quarter. (See Figure 10.) There were only 910 homes available at the end of September 2020 compared to 926 at the end of June.

Months of Supply
The months-of-supply of homes on average for the third quarter 2020 was 1.4 months but only 0.4 months (12 days) for homes priced below $150,000 at the third quarter sales level. Homes priced between $150,000 and $200,000 was only slightly longer at 0.5 months. All price bands saw a reduction in the months-of-supply compared to the same period in 2019.
Months-of-Supply for all homes has fallen from an average of 8.5 months in third quarter of 2011 to 1.4 months in 2020. See Figure 11.


Total homes-not-sold (pending sales plus available inventory) at the end of the quarter continues to fall. There were 910 homes listed at the end of the third quarter 2020 while there were 595 home sales pending for a total of only 1,669 homes “not sold” in Madison County. There was an increase of 164 in the number of pending sales to 759 from September 2019. See Figure 12.
Sales & Average Inventory Trends
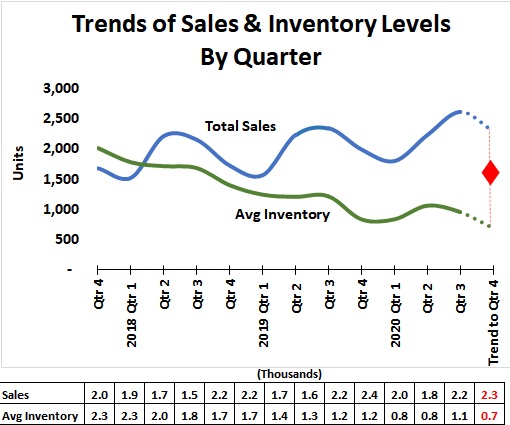
Average inventory of homes available for sale (green line in Figure 14) continues to decline while the number of units sold (blue line) continues to increase. To sustain this trend, a significant number of newly constructed homes and/or newly listed homes will be needed. Otherwise, prices are likely to rise. Note, a sudden increase in mortgage rates could negatively impact demand and subsequently prices.
Figure 14 suggests the level of sales may fall in the fourth quarter of 2020. The number of listed homes may also decline if sales do not significantly slow. The red diamond area represents the potential gap between supply and demand for homes in the fourth quarter residential real estate market should current trends continue. Note that an unexpected shock to the economy may unpredictably affect the demand for and/or supply of homes.
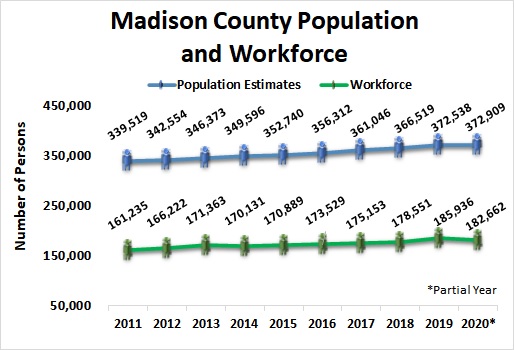
Real estate activity is subject to many forces including the number of people needing housing, their ability to purchase, and the confidence they have in the stability of their future income. The economy of the region represented by the area’s Gross Domestic Product (GDP) may also provide insight into the future real estate industry.
Households
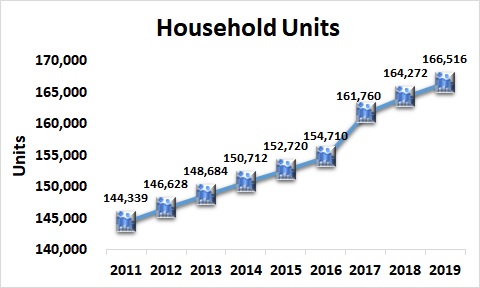
The number of households represents the number of housing units of all types in the area — Madison County. Households may be comprised of nuclear families, extended families, individuals living alone as well as housing for unrelated roommates. Housing units should generally move in relation to population but not always at the same rate – there may be time lag.
The number of housing units in Madison County, Alabama grew from 144,339 in 2011 to an estimated 166,516 in 2019 (the most recent estimate available) per the U.S. Census Bureau. This is an increase of 15% over the decade. See Figure 16.
Household Income
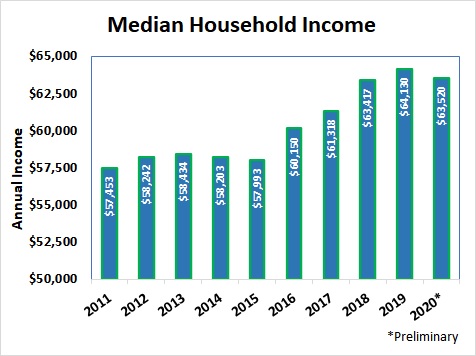
A rule of thumb for housing affordability is that housing costs should not exceed 30% of household income suggesting that the Annual Household Income in a region could be used as a proxy for housing affordability. The preliminary estimate for median annual household income at mid-year 2020 is $63,520. This level is down from the 2019 peak and likely reflects the economic conditions resulting from the pandemic impacts. The Median level represents the point where one-half of the households have income above and one-half have income below the level. Overall, the Annual Median Household Income in current dollars has grown by 10.5% since 2011. See Figure 17.
Gross Domestic Product – Huntsville Metropolitan Statistical Area
Gross Domestic Product is the sum of all goods and services produced in the region. The Huntsville Metropolitan Statistical Area is comprised of Limestone and Madison Counties.
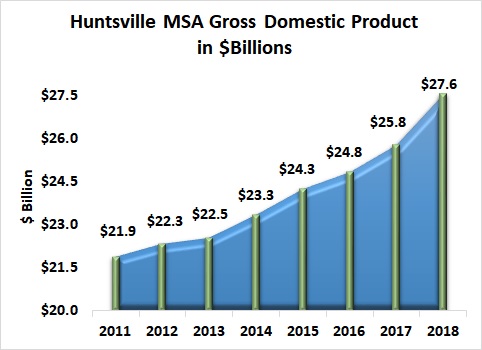
Gross Domestic Product for the Huntsville MSA (Madison & Limestone Counties) grew to approximately $27.6 billion dollars in 2018, the most recent year data available. This is an increase of 26% since 2011. See Figure 18.
Economic Growth Developments
The Chamber of Commerce of Huntsville/Madison County is the lead economic development organization in Madison County. Existing industry and new industry announcements may provide insight into the economic activity in the coming year. These announcements can be found at this link.
www.hsvchamber.org/departments/economic-development/economic-development-highlights/
Data Sources:
- Alabama Department of Labor
- Huntsville Area Association of Realtors Quarterly Reports
- U.S. Bureau of Economic Analysis
- U.S. Census Bureau
- Valley MLS System
Analysis & Report Prepared by:
- Jeff Thompson, Project Director
- Brinda Mahalingam, Ph.D., Economist
- Karen Yarbrough, Editor
Questions regarding this report should be directed to:
Jeff Thompson, jeff.thompson@uah.edu, 256.361.9065