3rd Qtr Real Estate Market Beats ALL Years Since 2010
Posted on 11/15/2018
Posted on 11/15/2018

Record levels of home sales continue. During the 3rd Quarter of 2018, homes priced below $150,000 comprised the largest amount of the home sales during the quarter with 25%. Average and Median Sales Prices leveled off compared to the prior quarter. More specifically, Average Sales Price was up moderately by 1.8% from last quarter, but Median Sales Price slightly dipped to $205,333 from last quarter’s $206,020. However, 2018 still has been a record year. When compared with prior years, 3rd Quarter of 2018 beats all years since 2010 whether it’s in price, number of sales, or average days on market. Homes are still selling fast and at higher prices. It is important to note the increase in pending sales in the 3rd Quarter. There was a 119.4% increase in pending sales from last year and 35.3% increase from last quarter.
Demand for housing remains solid with the growing population, workforce, income, and Gross Domestic Product. It is reasonable to expect that the market momentum will continue into the 4th Quarter showcasing a healthy real estate market for the fiscal year of 2018. Once again, inventory appears to be an exacerbating issue going from 2.6 Months of Supply in the 2nd Quarter of 2018 to 2.4 Months of Supply 3rd Quarter of 2018.
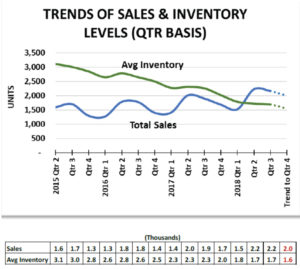
Our trend model suggests that sales volume and inventory will decline slightly as normally occurs in the 4th Quarter of each year. See Figure 12. Note that a shock to the economy could occur on any given day and would affect demand for or supply of homes or both. A simple growth trend calculation suggests that sales could reach 2,000 units on inventory of 1,550 if all conditions theoretically remain constant.
You can read the full report below or download it HERE.
Third Quarter Recap
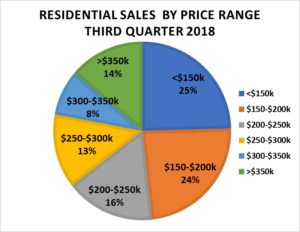
Record levels of home sales continue. During the 3rd Quarter of 2018, homes priced below $150,000 comprised the largest amount of the home sales during the quarter with 25%. Figure 1 shows the percentage of sales in each of six price bands.
Average and Median Sales Prices leveled off compared to the prior quarter. More specifically, Average Sales Price was up moderately by 1.8% from last quarter, but Median Sales Price slightly dipped to $205,333 from last quarter’s $206,020.
However, 2018 still has been a record year. When compared with prior years, 3rd Quarter of 2018 beats all years since 2010 whether it’s in price, number of sales, or average days on market. Homes are still selling fast and at higher prices. It is important to note the increase in pending sales in the 3rd Quarter. There was a 119.4% increase in pending sales from last year and 35.3% increase from last quarter.
Demand for housing remains solid with the growing population, workforce, income, and Gross Domestic Product. It is reasonable to expect that the market momentum will continue into the 4th Quarter showcasing a healthy real estate market for the fiscal year of 2018. Once again, inventory appears to be an exacerbating issue going from 2.6 Months of Supply in the 2nd Quarter of 2018 to 2.4 Months of Supply 3rd Quarter of 2018.
Report Content
I. Real Estate Analysis Focus
II. Sales & Price Levels
III. Market Momentum
IV. Inventory Status
V. Demographics
VI. Local Area Outlook
VII. Other Economic Insight
VIII. Data Sources
I. Real Estate Analysis Focus: Home Features
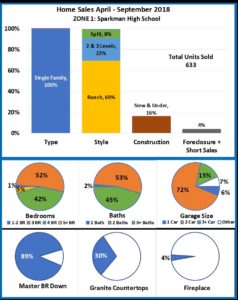
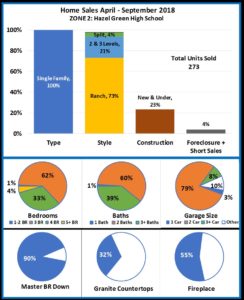
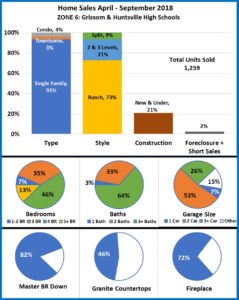
The 3rd Quarter is generally the peak season for home sales in Madison County. The features of the homes sold during this sold during 3rd quarter may suggest the features most attractive to buyers. This analysis examines home sales in eight zones generally aligned with high school districts. The home features in the analysis were selected to represent the attractiveness of homes sold during the six-month period April through September 2018. The results of this six month analysis are very similar to the twelve-month analysis included in the 2nd-Quarter 2018 Residential Real Estate Report. Note that the location change of Grissom High School could affect home sales and construction of new homes in Zone 6 in the future.
The analysis includes overall Madison County plus eight zones. The zones represented by one or more high school districts are:
• Zone 1 – Sparkman High School (Northwest)
• Zone 2 – Hazel Green High School (North)
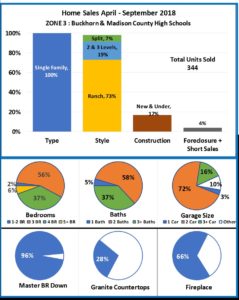
• Zone 3 – Buckhorn High School and Madison County High School (Northeast)
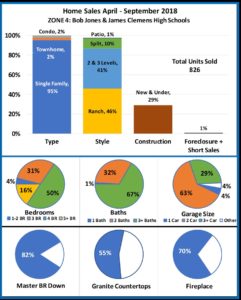
• Zone 4 – Bob Jones High School and James Clemens High School (West)
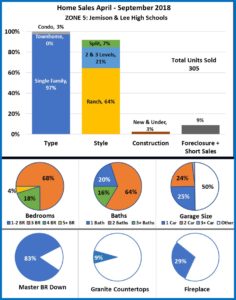
• Zone 5 – Jemison High School and Lee High School (North and East)
• Zone 6 – Grissom High School and Huntsville High School (Central and Southwest)
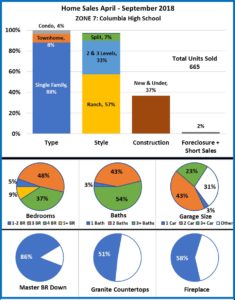
• Zone 7 – Columbia High School (Central and West)
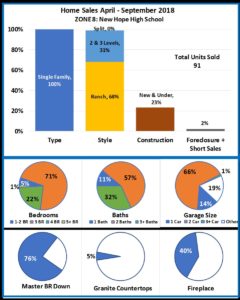
• Zone 8 – New Hope High School (Southeast)
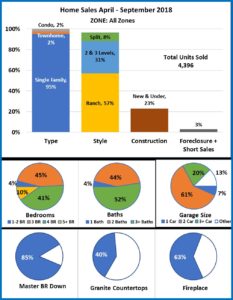
Figure 1 shows the percentage of homes sold in this period by type of home, the style of home, new/under construction homes, and homes in foreclosure or short sale situation. The total number of homes sold is shown with each group of charts.
The same ten features or tastes and preferences of buyers of the previous report were analyzed and are broken down in the subsequent diagrams (pages 3-11). The pie charts show the percentage of homes sold during this 6-month period by number of bedrooms, baths, garage
size, master bedroom level, presence of granite countertops, and presence of at least one fireplace.
Similar to last quarter’s analysis, the “ideal” home in Madison County between April 2018 and September 2018 was a 3-bedroom, 3-bath single-family ranch style home with a downstairs master bedroom, non-granite countertops, a fireplace, and a 2-car garage. One-fourth of the homes sold were newly constructed or under construction at the time of sale. See Figure 2.
Real Estate Analysis Focus: Home Features
Madison County Overall Summary
II. Sales & Price Levels
Residential Sales
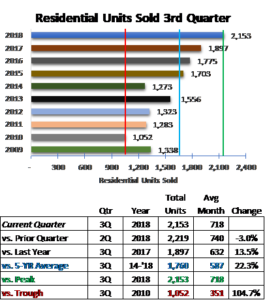
Residential home sales started to slow slightly in the 3rd Quarter with 2,153 homes sold vs. last quarter with 2,219 homes. However, as with
the past quarters 2018 has been a record year with a 13.5% increase in sales compared to 2nd Quarter 2018. Additionally, the sales grew by
22.3% above the five-year average of 3rd quarter sales.
The vertical green line represents the peak level of sales between 2009 and 2018 for the 3rd quarter. The blue vertical line represents the five-year 3rd quarter average number of sales. The red line represents the lowest number of homes sold. See Figure 11.
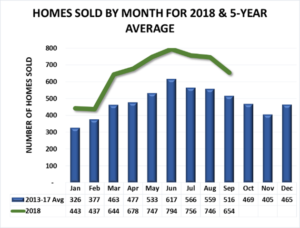
Seasonality of Sales
The sales for this past quarter started to taper off in August decreasing from 746 homes to 654 homes in September. June of this year has been the best month in terms of sales with 794 homes sold. The summer months tend to be the hottest months in terms of sales and
are historically shown to occur from May through August. See Figure 12.
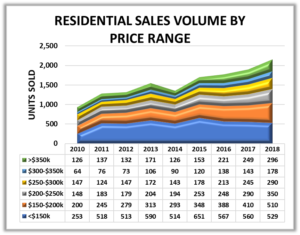
Sales Volume by Price Range
Homes with sale prices below $150,000 continue to comprise the largest share (25%) of total sales but saw a decline of 36 units from the level in the 2nd Quarter 2018.
The largest percentage increase in sales occurred in the $150,000 – $200,00 price range at 24% growth from the 3rd quarter 2017. Additionally, the homes priced between $300,000 -$350,000 grew by the same amount quarter over quarter. See Figure 13.
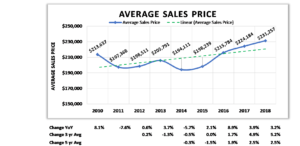
Average Sales Prices
The average sales price for all homes sold during the 3rd Quarter 2018 was $231,257, a 3.2% increase from the 2017 3rd Quarter average selling price of $224,184. See Figure 14.
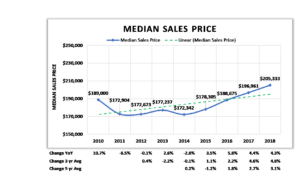
Median Sales Price
The median (midpoint) sales price in Madison County for the 3rd quarter of 2018 reached $205,333 a 4.3% increase from the 3rd quarter 2017. The five-year average sales price grew by 3.1% in the past year. See Figure 15.
III. Market Momentum
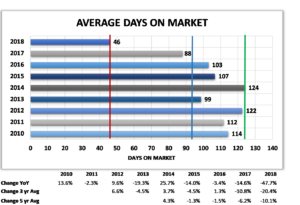
Days on Market
The average number of days on the market (DOM) in the 3rd Quarter of 2018 dropped to 46 days, the lowest DOM (red line) since 2010. This is a drop of 47.7% from 2017. The greatest DOM 3rd Quarter level was reached in 2014 (green line) at 124 days with the five-year average DOM at 94 days (blue line). See Figure 16.
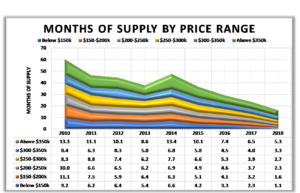
Months of Supply
Months of Supply of homes available for sale dropped in all six price bands. Homes with sales prices below $150,000 has the lowest available inventory at 1.1 months. Homes priced above $350,000 represent 5.3 months of sales at the 3rd Quarter level of sales. See Figure 17.
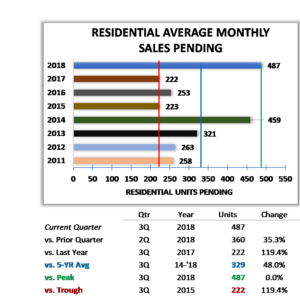
Pending Sales
At the end of the 3rd Quarter 2018 there were 487 sales pending to be closed, an increase of 119.4% from the end of the 3rd Quarter 2017.
This is the largest number of sales pending since 2011 and is marked as such with the green vertical line.
The lowest level (red vertical line) of sales pending occurred in 2017 with 222 sales pending. The five-year average number of sales pending (blue vertical line) for 2014-2018 3rd Quarter was 329 units. See Figure 18.
IV. Homes for Sale Inventory Status
Homes for Sale
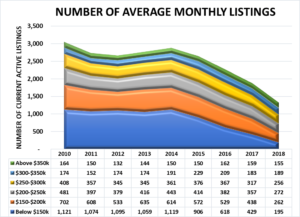
The average number of residential units available for sale in the 3rd Quarter of 2018 decreased to 1,691. The inventory of homes for sale continues to decline. See Figure 19.
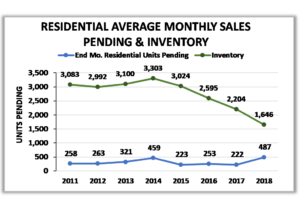
The number of homes listed for sale (green line) at September 30, 2018 dropped from the previous June 30, 2018 level as well as the end of each 3rd Quarter of each year since 2014. The number of sales pending (blue line) has remained fairly steady since 2014 with the
exception of this past year which we see a sharp uptick in pending sales. See Figure 20.
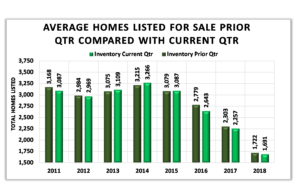
The greatest decrease in the monthly average number of homes listed for sale this quarter from the 3rd Quarter 2017 was in homes with a sales price below $150,000 (55% or a drop of 234 homes) from the 3rd Quarter 2017. See Figure 22.
Inventory-to-Sales Ratio
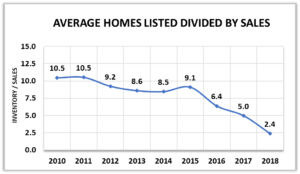
The quarterly average number of homes listed for sale (inventory) divided by the current quarterly average sales results in a metric of 2.4 houses available for sale for each house sold in the 3rd Quarter. This is a little over 1/5th of the level observed in 2010. See Figure 23.
V. Key Demographics
Real estate activity is subject to many forces including the number of people needing housing, their ability to purchase, and the confidence they have in the stability of their future income. The economic strength of the region represented by the area’s Gross Domestic Product (GDP) may also provide insight into the future of the real estate industry.
Madison County Population & Workforce Trends
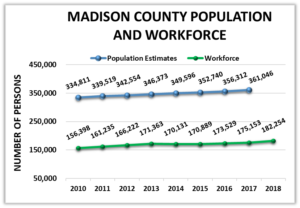
Population of Madison County as counted by the U.S. Census Bureau has grown steadily since the 2010 census. The population in 2010 was 334,811 persons. The most recent annual estimate of Madison County’s total population shows a 7.8% increase to 361,046 in 2017 from 2010. See the blue line in Figure 22. The workforce is comprised of the number of people working and looking for work. The annual workforce (green line) has also risen since 2010 by 16.5% to reach 182,254 in 2018.
Households
The number of households represents the number of housing units of all types needed in the area, Madison County. Households may be
comprised of nuclear families, extended families, individuals living alone as well as housing for unrelated roommates. Housing units
should generally move in relation to population but not always at the same rate –there may be lag.
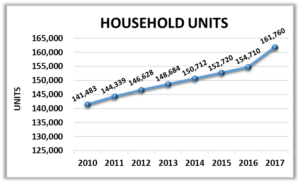
The number of housing units in Madison County, Alabama grew from 141,483 in 2010 to an estimated 161,760 in 2017 (the most recent year data is available) per the U.S. Census Bureau. This is an increase of 14.3% over the seven-year period. See Figure 23.
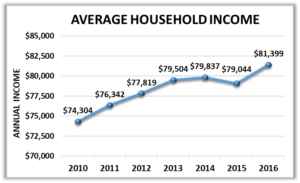
Average Household Income
The Average Household Income suggests an income level in the region that could be used to estimate housing affordability. Overall, the Annual Average Household Income in current dollars has grown significantly (9.5%) since 2010. A slight drop in 2015 more than recovered to $81,399 in 2016 (the most recent year data is available). See Figure 24.
Gross Domestic Product – Huntsville Metropolitan Statistical Area
Gross Domestic Product is the sum of all goods and services produced in the region. The Huntsville Metropolitan Statistical Area is comprised of Limestone and Madison Counties, Alabama.
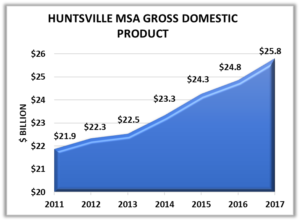
Gross Domestic Product for the Huntsville MSA grew by 13.2% from 2011. Gross Domestic Product reached $25.8 billion dollars in 2017 (the most recent year data is available) which is a growth of 4% from 2015. See Figure 25.
VI. Local Area Outlook
Sales & Average Inventory Trends
If average inventory of homes available for sale (green line) continues its downward trend and if the number of units sold (blue line) also continues its upward trend, there will be upward pressure on prices.
Figure 26 suggests that sales volume and inventory will decline slightly as normally occurs in the 4th Quarter of each year. See Figure 12. Note that a shock to the economy could occur on any given day and would affect demand for or supply of homes or both. A simple growth trend calculation (dotted line) suggests that sales could reach 2,000 units on inventory of 1,550 if all conditions theoretically remain constant.
VII. Other Economic Insight
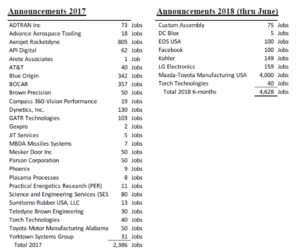
Madison County Job Announcements
Economic development announcements of new and expanding industry are the result of the local community working to grow the economy. It should be noted that the number of jobs announced may be realized over several years while the new or expanded plant is built and employees are hired. The economic development announcements for 2017 and the first six months of 2018 in Madison County are shown on the page below.
Data Sources:
• Alabama Department of Labor
• Chamber of Commerce of
Huntsville/Madison County
• Huntsville Area Association of
Realtors Quarterly Reports
• U.S. Bureau of Economic Analysis
• U.S. Census Bureau
• Valley MLS System
Analysis & Report Prepared By:
-Brinda Mahalingam, Ph.D., Economist
-Jeff Thompson, Project Director
-Madeline Glosemeyer, Student Research Assistant
Questions regarding this report should be directed to: Jeff Thompson, jeff.thompson@uah.edu, 256.361.9065
Click HERE to download the Huntsville Area Real Estate Economics Report – Third Quarter