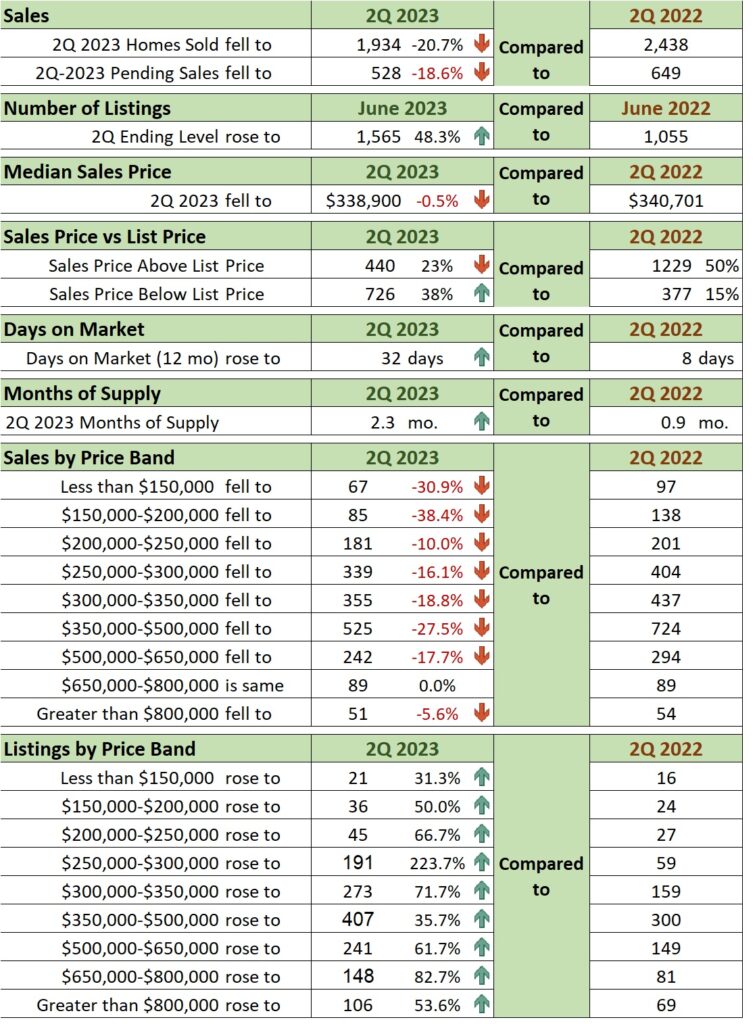
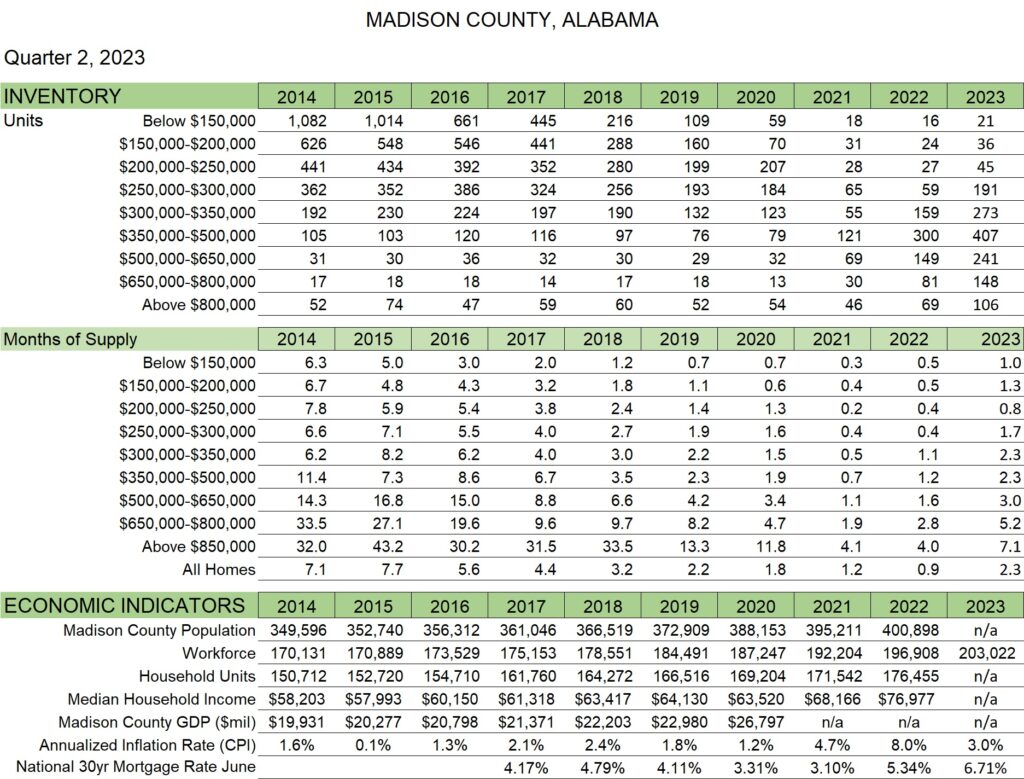
🏠 Inventory of homes rose almost 50% in 2Q 2023. Listings increased in all price bands. The largest percentage growth (224%) occurred in homes in the $250,000-$300,000 range.
🏠 Around 40% of this quarter’s sales were an average of 4% below the listed price. Unit sales below list price increased compared to 2Q 2022 which was only 15% of sales.
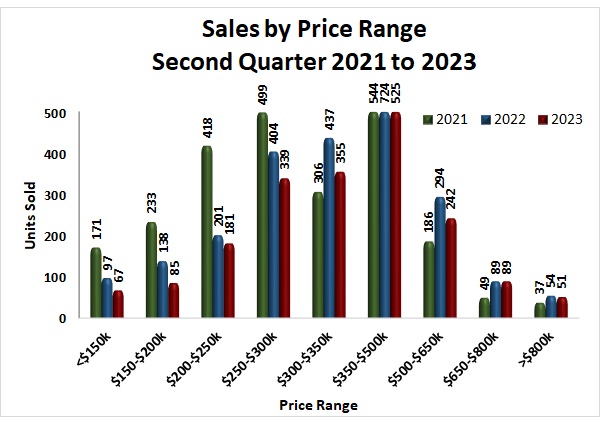
🏠 Sales declined in all home price bands except $650-$800k price range. The largest percentage decrease (38.4%) of sales occurred in homes priced between the $150,000-$200,000 range.
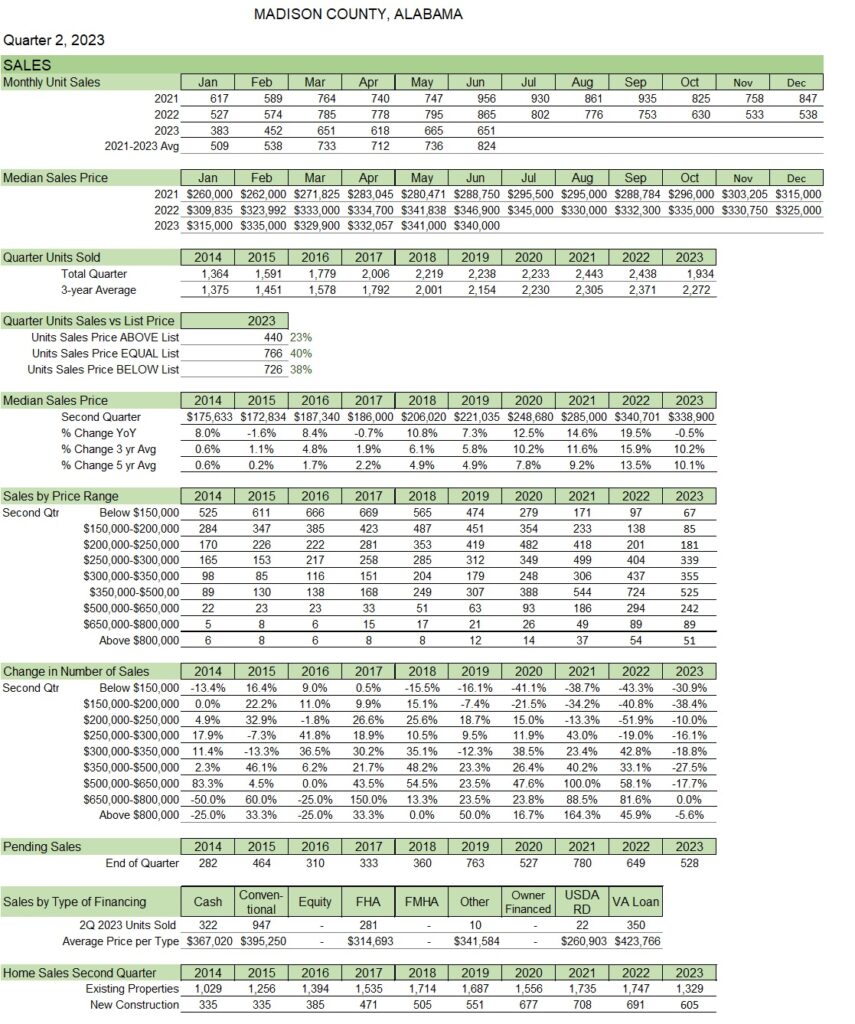
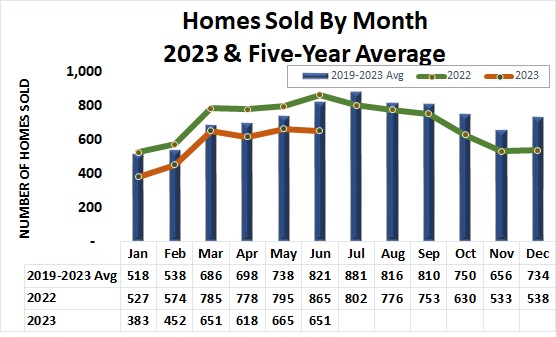
🏠 Monthly unit sales in 2023 was lower than the 2021, 2022 and three-year average levels.
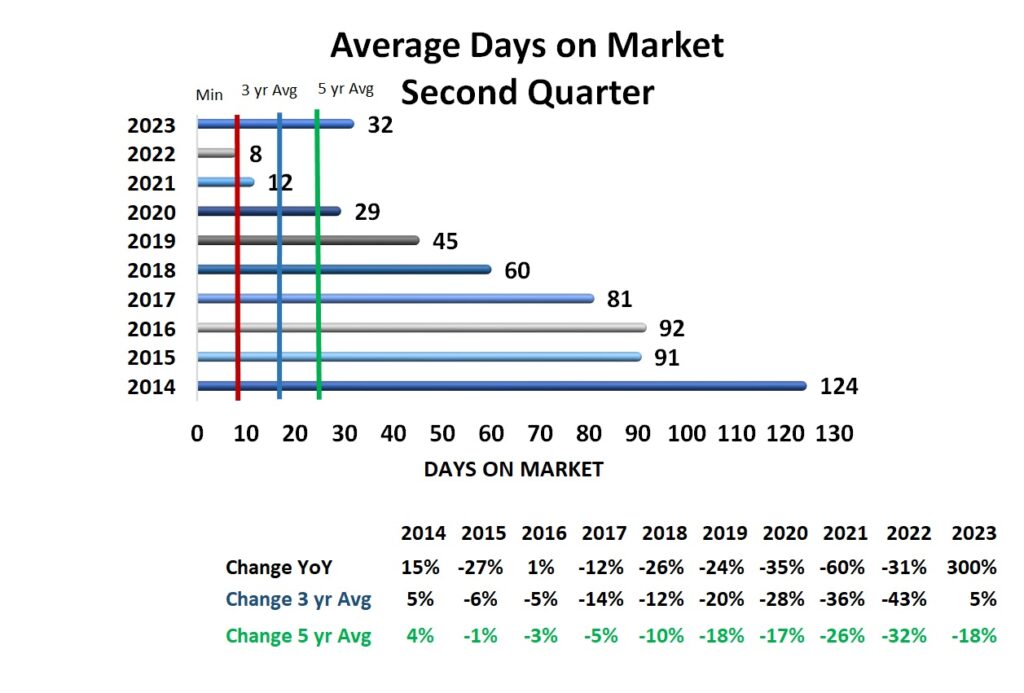
🏠 Average Days on Market significantly increased to 32 days. That is four times more than 8 days in 2Q 2022.
🏠 The consumer overall inflation rate fell to a rate of 3.0% in June.
🏠 The national average 30-year mortgage rates rose from 5.34% to 6.71% from 2Q 2022 to 2023.
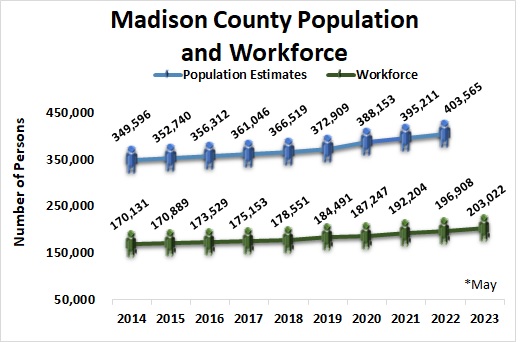
🏠 Madison County’s workforce grew 3.1% from 196,908 in 2022 to 203,022 in 2023.
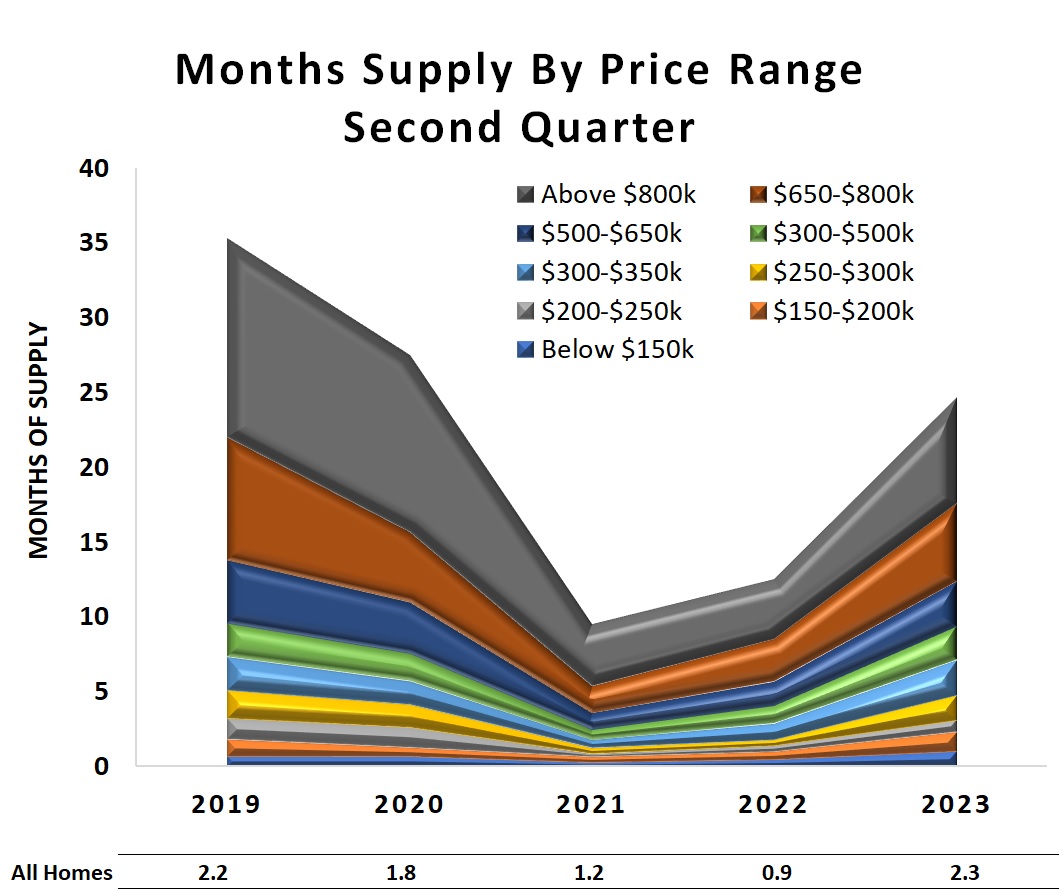
Months of supply of homes increased all price ranges compared to 2Q 2022. Months of supply increased to
2.3 months for all homes which is 156% more than the 2Q 2022 level. But it is 21% less than in the prior quarter, which was 2.9 months.
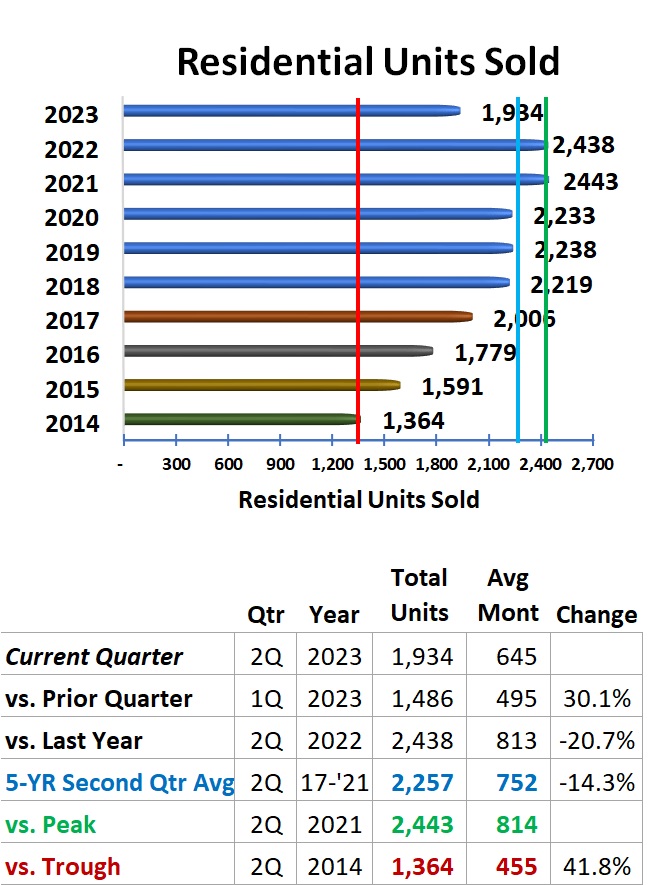
Total units sold continued to decline in 2Q 2023 compared to 2019, 2020, 2021, 2022 2Q levels. It is also 15% below the 3-year 2Q average level.
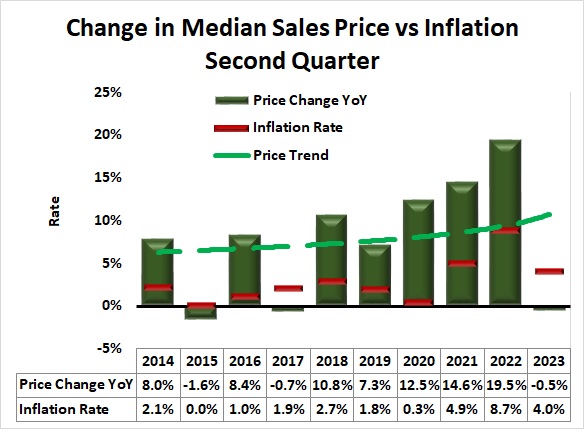
The consumer inflation rate fell to 3.0% in June, which is lower than the 2022 (8.0%) and 2021 (4.7%) average inflation rates. Inflation has fallen every month since June 2022, when it peaked at 9.1%, and is on its way toward the Federal Reserve’s target of 2%. The average inflation rate for 2Q 2023 is 4.0% which is 54% less than 2Q 2022 average (8.7%) and 31% less than 1Q 2023 average (5.8%).
According to Freddie Mac’s weekly data, mortgage rates continued their upward trajectory. The national average 30-year mortgage rates rose from 5.34% to 6.71% from 2Q 2022 to the end of 2Q 2023.
Figure 1
Figure 2
Q2 Market Snapshot
🏠 Inventory of homes rose almost 50% to 1565 from 2Q 2022 with the largest rise in the $250-$300,000 range.
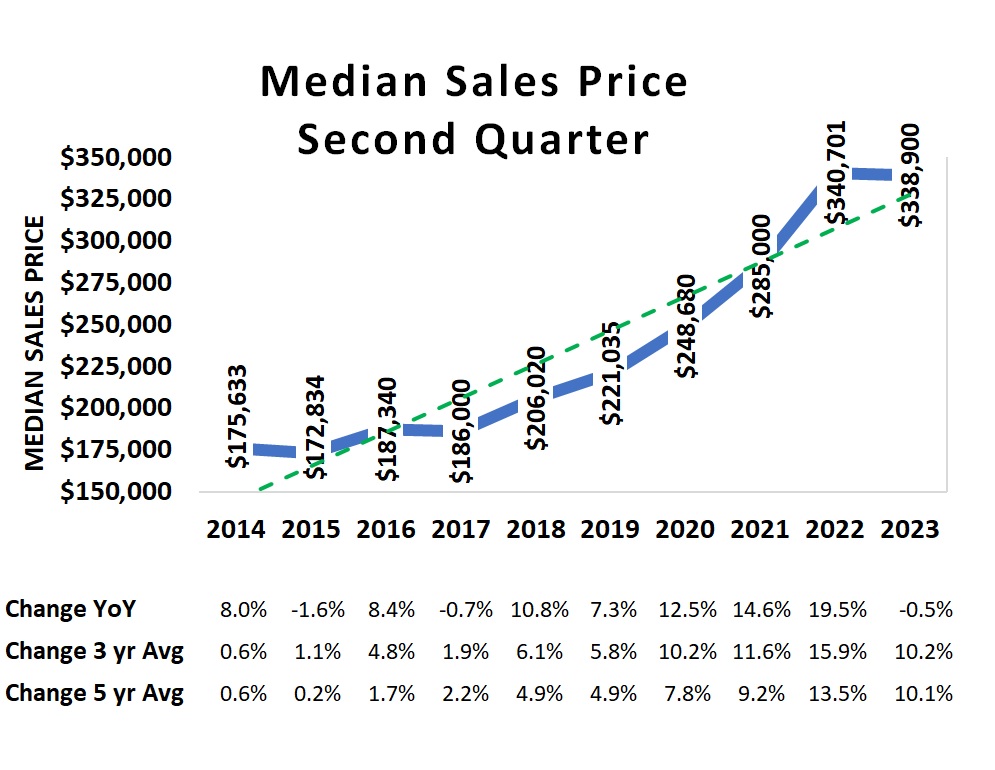
🏠 Median sales price for the quarter was slightly (0.5%) lower than 2Q 2022.
🏠 While sales declined, inventory increased in all home price bands.
🏠 Sales above list price decreased in 2Q 2023. (Table 1) 2022 to 203,022 in 2023.
Table 1
Q2 Key Metrics
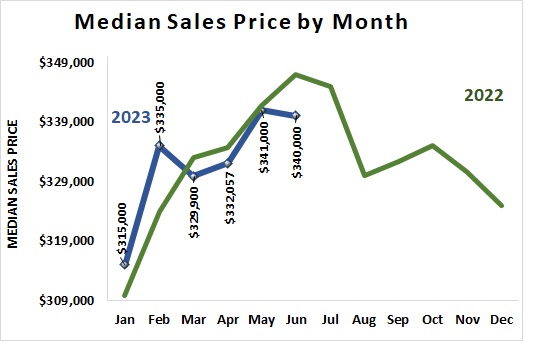
🏠 Median sales price decreased to $340,000 in June
🏠 Monthly unit sales in 2023 are lower than 2021, 2022 and three-year average
🏠 Sales of newly constructed homes remained strong at more than 30% of 2Q 2023 (Table 2)
Table 2
Q2 Metric Details
🏠 The highest level of inventory of homes was in the $350,000-$500,000 price range.
🏠 The months of supply increased in all price ranges compared to 2Q 2022.
🏠 Total units sold by month continued to decline in 2Q 2023. They are also lower than the five-year average levels. (Figure 3)
🏠 The average inflation rate for 2Q 2023 is 4.0% which is 54% less than 2Q 2022 average (8.7%).
Table 3
Figure 3
Figure 4
Q2 Metric Details, continued
🏠 Total units sold continued to decline to 1934 in 2Q 2023 compared to 2Q 2022 (2438) and 2Q 2021(2443) levels. (Figure 5)
🏠 The home median sales price of the second quarter fell to $338,900 from 2Q 2022. (Figure 6)
🏠 The monthly median sales prices for April, May, and June were slightly less than the respective months in 2022. (Figure 7)
Figure 5
Figure 6
Figure 7
Q2 Metric Details, continued
🏠 Sales declined in all home price bands. The largest percentage decrease in sales (38.4%) occurred in homes priced between the $150,000-$200,000 range. (Figure 8)
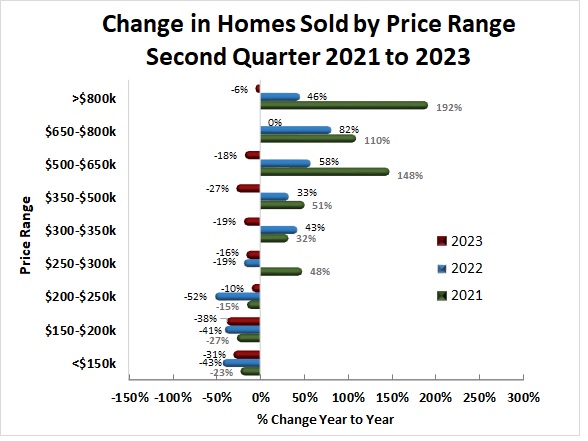
🏠 Sales of homes priced below $350,000 declined but at a slower level than in 2Q 2022. (Figure 9)
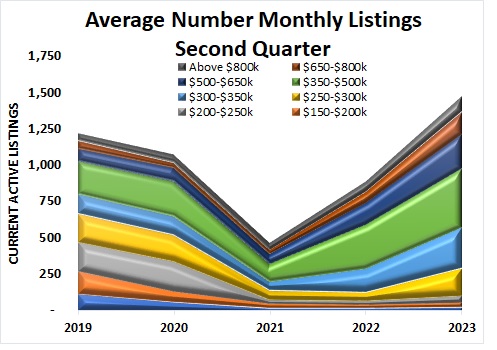
🏠 The total number of available homes increased in all price bands. The largest percentage growth (224%) occurred in the $250,000-$300,000 range. (Figure 10)
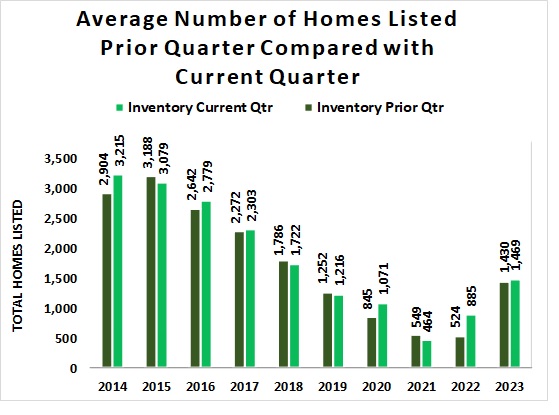
🏠 Compared to the prior quarter, the average number of listed homes slightly increased (2.7%) in the current quarter. (Figure 11)
Figure 8
Figure 9
Figure 10
Figure 11
Q2 Metric Details, continued
🏠 Average Days on Market significantly increased in 2Q 2023, by 300% from Q2 2022. (Figure 12)
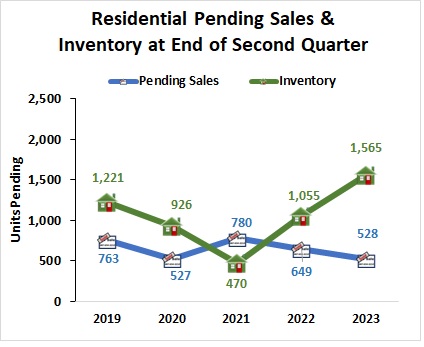
🏠 The quarterly number of homes pending sale fell from 2Q 2022 649 to 528 homes while the number of units on the market rose to 1565 in June 2023. (Figure 13)
🏠 Months-of-supply of homes increased across all price ranges. (Figure 14)
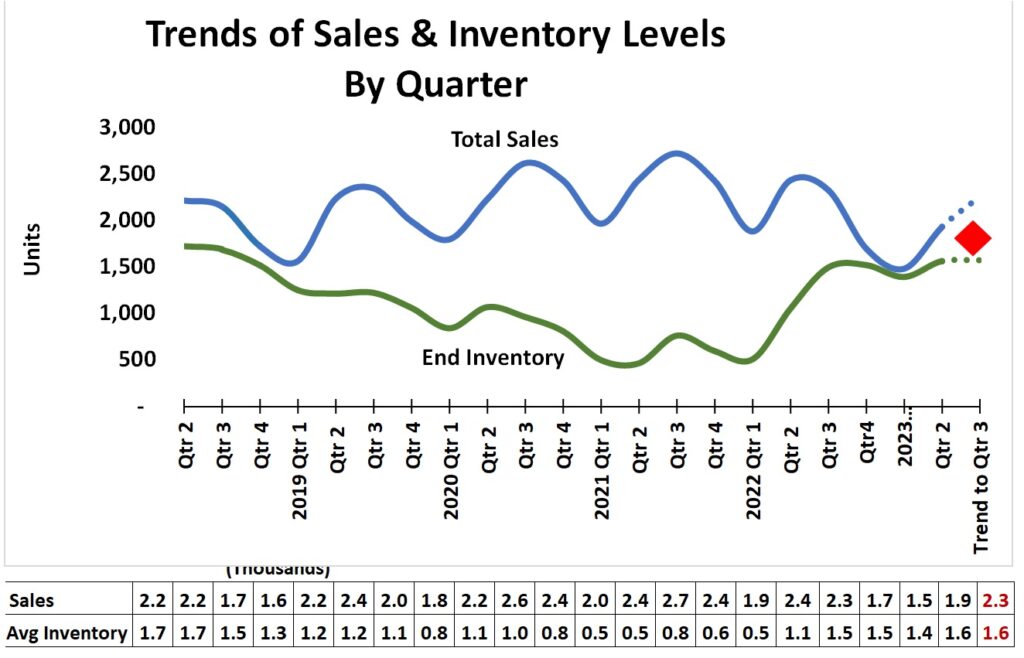
🏠 The sales and inventory levels trend suggests total sales could increase to 2265 in 3Q 2023 while the end inventory of listed homes may stay around 1600. (Figure 15)
Figure 12
Figure 13
Figure 14
Figure 15
Madison County Economic Indicators
🏠 Madison County’s population grew to 403,565 in 2022. (Figure 16)
🏠 Madison County’s workforce reached 203,022 in May 2023. (Figure 16)
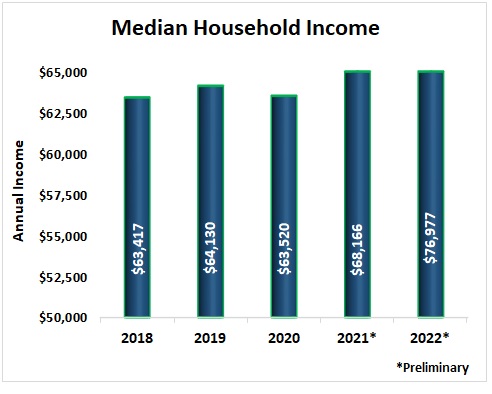
🏠 Median Household Income in Madison County rose to $76,977 in 2022, significantly above the pre- pandemic level. (Figure 17)
🏠 The number of household units grew to an estimated 176,455 in 2022. This represents all housing units comprising nuclear families, extended families, individuals living alone, and unrelated roommates. (Figure 18)
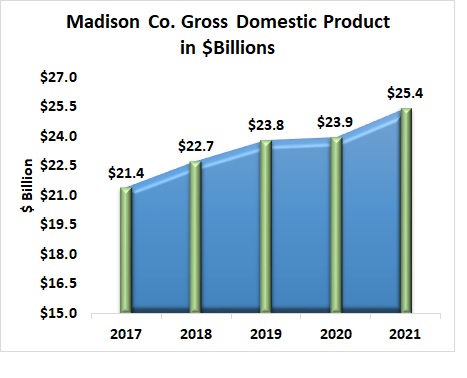
🏠 Gross Domestic Product (a monetary measure of the market value of all the final goods and services produced in a specific period) for Madison County rose 6.2% from 2020 to an estimated $25.4 (chained 2012 dollars) billion in 2021, according to the Bureau of Economic Analysis. (Figure 19)
Data Sources:
Alabama Department of Labor
Huntsville Area Association of Realtors Monthly Housing Statistics Reports
S. Bureau of Economic Analysis
S. Census Bureau
Valley MLS System
Analysis & Report Prepared by:
Brinda Mahalingam, Ph.D., Economist
Dilcu Barnes, Ph.D., Industrial Systems
Ege Can, Ph.D., Economist
Questions regarding this report may be directed to: