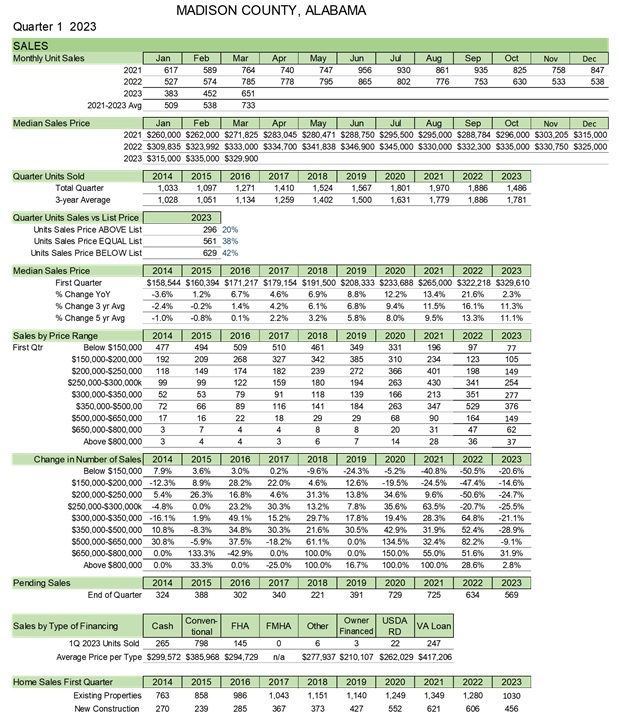
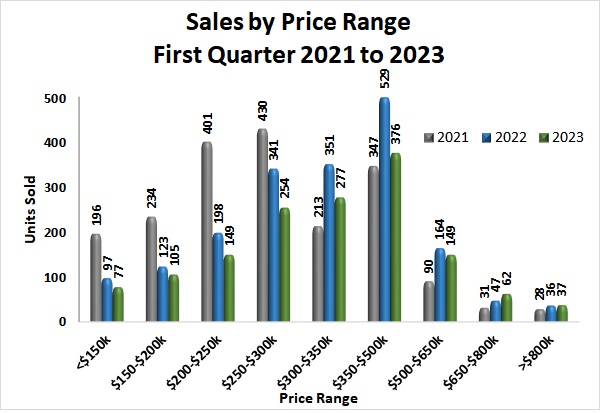
Sales for homes priced below $300,000 continued to decline in 1Q 2023 compared to 1Q 2021 and 1Q 2022 levels. Sales for homes priced $300,000-$650,000 were higher than 1Q 2021 but less than 1Q 2022 levels. However, sales for homes priced above $650,000 increased compared to 1Q 2021 and 1Q 2022.
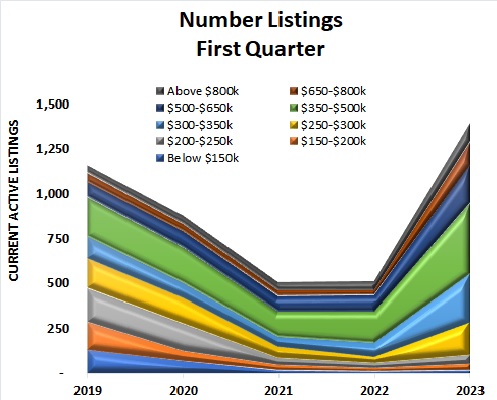
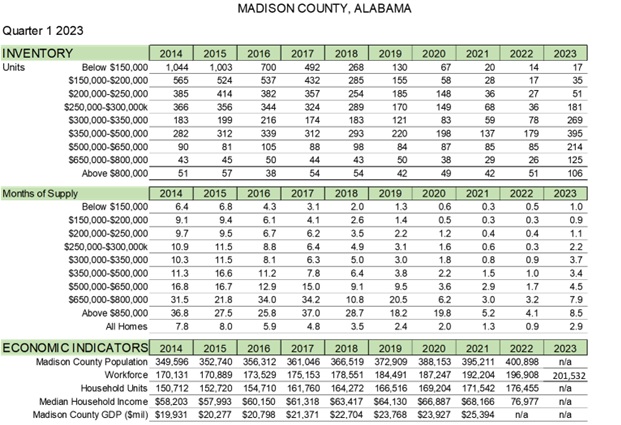
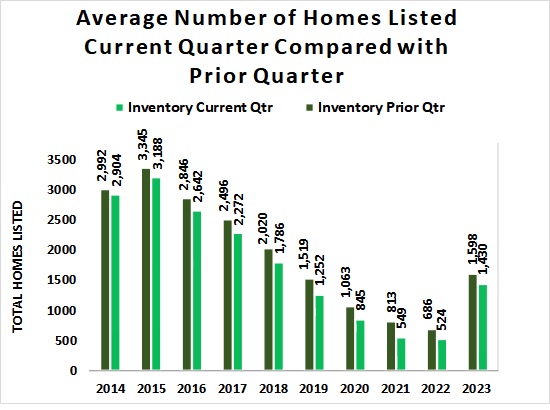
The available homes rose significantly across all price ranges compared to 1Q 2022. The average number of available homes for 1Q 2023 (1430) was significantly more than 1Q 2022 (524) but slightly less than 4Q 2022 (1598). The new construction inventory significantly increased over the last year compared to the existing home inventory. The average new construction inventory for 1Q 2023 is 840 which is almost 200% more than 1Q 2022 (288).
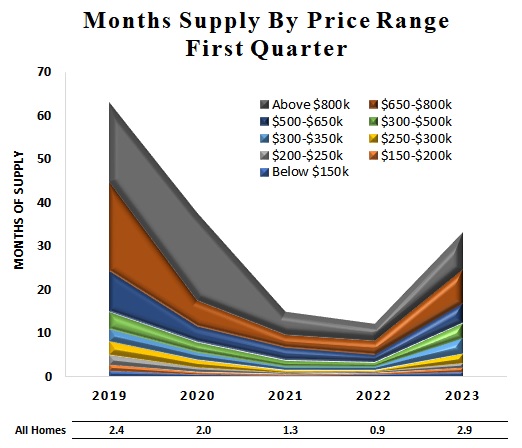
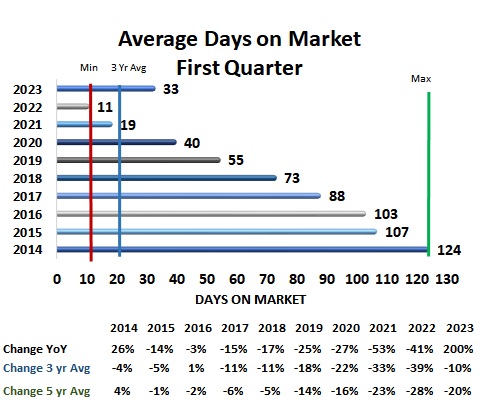
The months of supply for all homes continued to increase, which is more than 2022 1Q, 2Q, 3Q and 4Q levels. Average Days on Market significantly increased to 33 days. That is three times more than the 11 days in 1Q 2022 and 90% more than the 17.3 days in the previous quarter, 4Q 2022.
According to Freddie Mac weekly data mortgage rates continue to trend down. 30-year fixed rate mortgage averaged 6.32% as of March 30th, which was down from the previous week’s 6.42% but still higher than the pre-pandemic level. In addition, the consumer inflation rate was 5% in March which is the lowest since May 2021. But it’s still well above the Federal Reserve’s 2% target.
Q1 Insight Focus
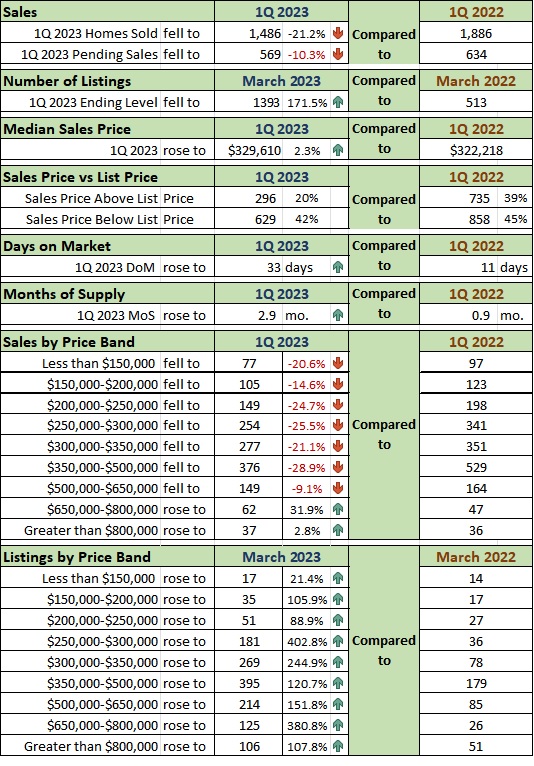
The number of available homes rose significantly across all price ranges. The total number of available homes for 1Q 2023 is 171.5% more than 1Q 2022.
Average Days on Market significantly increased to 33 days. That is three times more than the 11 days in 1Q 2022.
Months of supply increased across all price ranges. Months of supply for all homes is 2.9 months, which is over 200% more than 1Q 2022 value (0.9 months).
Sales of homes priced below $650,000 fell by around 23% compared to 1Q 2022. Sales of homes priced above $650,000 increased by 16%.
Q1 Market Snapshot
• The number of units on the market increased dramatically (171.5%) compared to March 2022. • The number of homes sold above list price decreased (296) compared to the 1Q 2022 (735). • The sales of homes priced below $650,000 fell from the 1Q 2022 while sales of homes priced above $650,000 slightly increased compared to 1Q 2022. The number of listings increased in all price ranges. • Average days on market was 33 days for the quarter which was three times more than the 1Q 2022.
Q1 Key Metrics
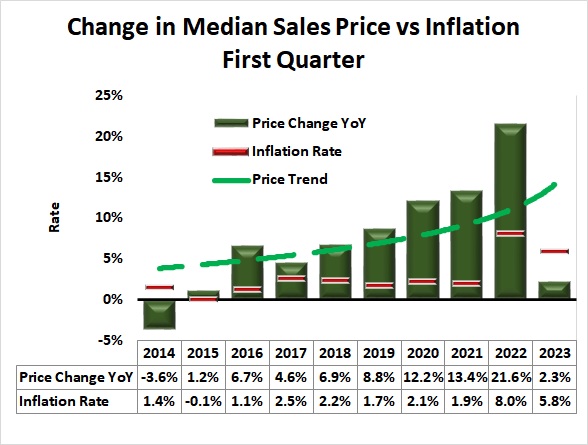
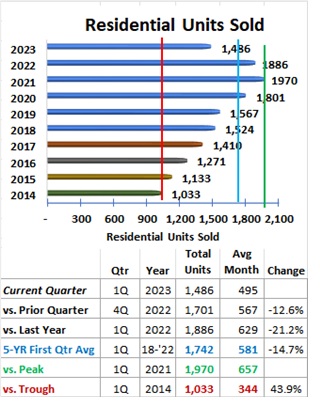
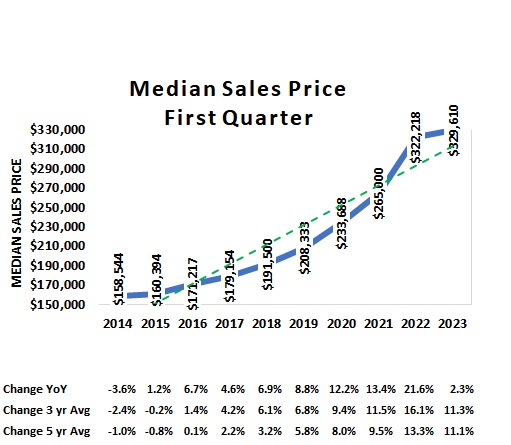
• The median sales price for the quarter was slightly (2.3%) higher than 1Q 2022. • First time the total number of homes sold for the quarter was less than the three-year first quarter average. (Table 2)
Q1 Metric Details
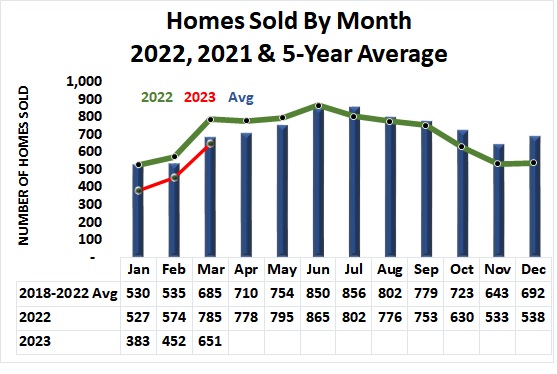
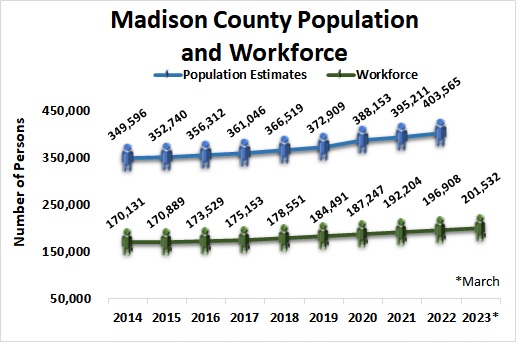
• The highest inventory level remained in the $350,000 and $500,000 price range. • The average months of supply for all homes increased by more than 200%. • Madison County’s workforce grew by 2.3% from the 2022 average through March 2023. (Table 3) • Homes sold by the month were less than the 1Q 2022 and the five-year (2018-2022) annual average.
Q1 Metric Details
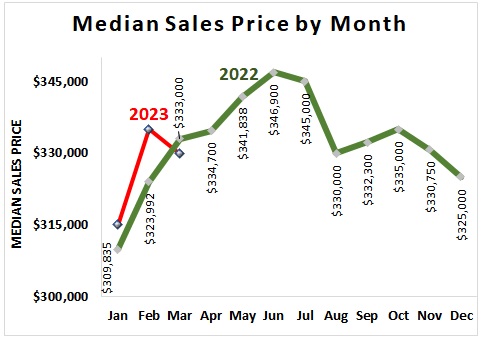
• Total units sold was 1,436 which is below the 1Q 2022 (1886), the previous quarter 4Q 2022 (1701) and the first-quarter 5-year average (1742). (Figure 5) • The median sales price of the first quarter continued to increase ($329,610). However, compared to the 1Q 2022 value ($322,218) the difference is not significant. (Figure 6) • The median sales prices for January and February were above the same months in 2022. However, the median sales price of March 2023 is slightly less than that of March 2022. (Figure 7)
Q1 Metric Details
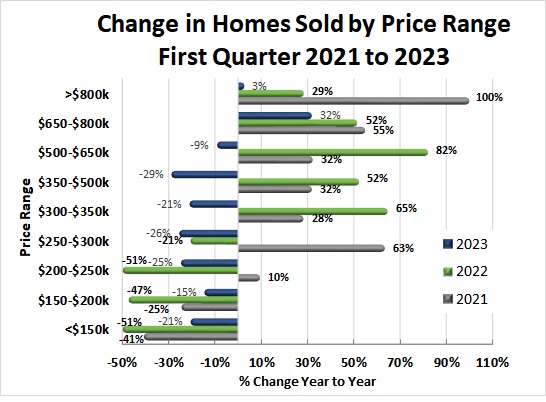
• Sales for homes priced below $300,000 continued to decline in 1Q 2023 compared to 1Q 2021, 1Q 2022 levels. However, sales for homes priced above $650,000 increased compared to 1Q 2021 and 1Q 2022. (Figure 8) • Sales of homes priced below $300,000 declined but at a slower level than in 1Q 2022. (Figure 9) • The number of available homes rose significantly across all price ranges. The total number of available homes for 1Q 2023 (1393) is 171.5% more than 1Q 2022. (Figure 10) • The current quarter compared to the prior quarter’s average number of listed homes shows that the first quarter inventory has fallen each year since 2014. (Figure 11)
Q1 Metric Details
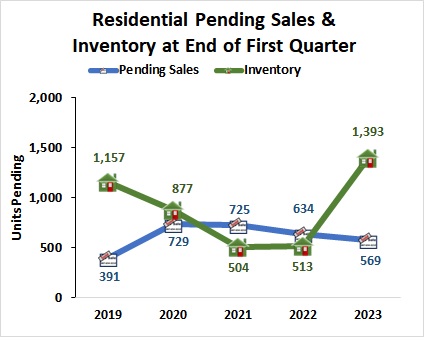
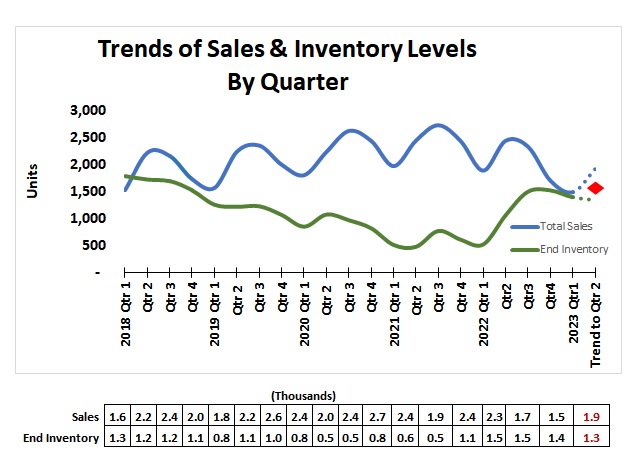
• Average Days on Market significantly increased to 33 days. That is three times more than the 11 days in 1Q 2022. (Figure 12) • The end of quarter number of units pending decreased to 569 homes in 1Q 2023 which is around 10% less than 1Q 2022 (634). (Figure 13) • Months of supply of homes increased across all price ranges. Months of supply for all homes is 2.9 months, over 200% more than 1Q 2022 value (0.9 months). (Figure 14) • The trend for sales and inventory levels suggests total sales could go up to 1913 in 2Q 2023 while the ending inventory of listed homes may go down to around 1300. (Figure 15)
Madison County Economic Indicators
• Average Days on Market significantly increased to 33 days. That is three times more than the 11 days in 1Q 2022. (Figure 12) • The end of quarter number of units pending decreased to 569 homes in 1Q 2023 which is around 10% less than 1Q 2022 (634). (Figure 13) • Months of supply of homes increased across all price ranges. Months of supply for all homes is 2.9 months, over 200% more than 1Q 2022 value (0.9 months). (Figure 14) • The trend for sales and inventory levels suggests total sales could go up to 1913 in 2Q 2023 while the ending inventory of listed homes may go down to around 1300. (Figure 15)
Data Sources:
Alabama Department of Labor
Huntsville Area Association of Realtors Monthly Housing Statistics Reports