2022 Q4 & Annual Real Estate Econ Report

MOMENTUM GATHERS AGAIN IN 2022

Demand for housing in the Madison County area remained strong in 2022.  Limited availability of homes continued through the first half of the year but improved in the second half.  Prices remained elevated while days on market stayed well below one-month.  Sales in the second half of the year began to moderate which allowed the inventory of available homes to grow.  Some of the headwinds for housing sales included consumer inflation increasing to levels not seen in decades and mortgage rates doubled significantly affecting housing affordability in the local market. 
The strength of the local economy continues to attract new residents as well as provide new opportunities for existing residents which kept housing demand strong even with the challenges of inflation, workforce attraction, and recovery from the pandemic.  Seller expectations and buyer demands became more aligned which helped in rebalancing the overall housing market in Madison County.
Figure 1
Figure 1 shows the annual number of homes sold (blue columns) and the average interest rate for 30-year conventional mortgages.  The mortgage interest rate has a significant impact on, and is inversely related to, the number of homes sold.   Since 2018, sales increased as rates decreased.  However, strong economic growth in the region allowed sales to climb in 2016, 2017, and 2018 even with rising interest rates.  Sales fell in 2022 as mortgage rates doubled the 2021 levels.    The strength in home sales in Madison County may continue to defy the interest rate-to-sales relationship as new employers and new residents are welcomed to the area but the momentum in the housing market may be more difficult to maintain.

ANNUAL RECAP

Prices (median) for residential real estate in Madison County again reached new monthly highs in each of the first six months of the year.  Annual home sales of 8,356 was down from 2021’s all-time high 9,569 but the total value of all sales in 2022 remained in excess of $3.1 billion.  See Figure 2.  Total existing home sales value  ($1.9 billion) in 2022 was down from $2.1 billion in 2021.  New construction sales reached $1.05 billion compared to $961 million in 2021.  Condos & townhomes sales also increased to $43.8 million. 
The 8,356 properties sold in 2022 had an average days-on-market (DOM) of 12 days compared to 13 days last year and 115 days in 2014.  The annual median sales price rose 15.8% to $332,360, still above the previous annual high of $287,000 reached in 2021.  There were approximately 9,276 new listings during the year compared to 9,406 in 2021.  By the end of 2022, there was only 1.6 months (48 days) of supply.  For perspective, convention suggests that a balanced market has a 180-day supply of homes.

SALES VOLUME

Sales volumes declined in three quarters of 2022 relative to the prior quarter level.

INVENTORY

The number of homes listed improved in 2022 climbing higher in 10 months resulting in a year-end level 153% above Dec. 2021.   See Table 1.  Newly constructed homes available rose to an average of 603 compared to the 2021 monthly average of 302.

DAYS ON MARKET

Average days-on-market for the year was 12 days, slightly below the 13 days-on-market in 2021.  See Table 1.
Table 1

PRICE

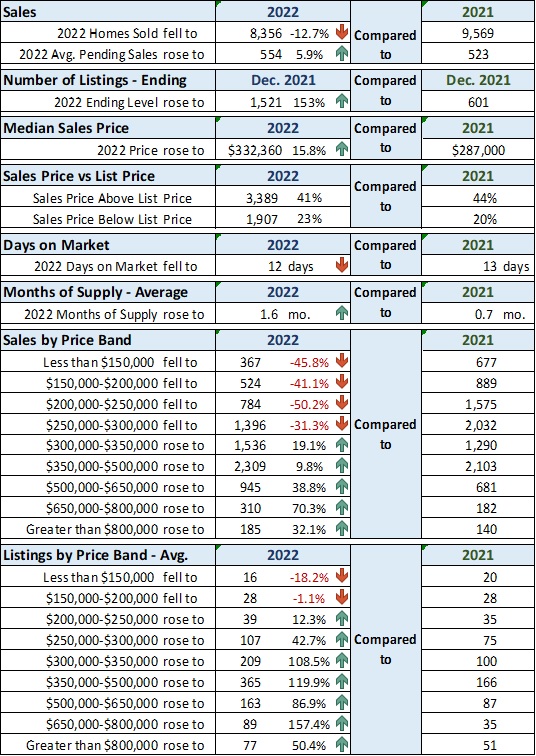
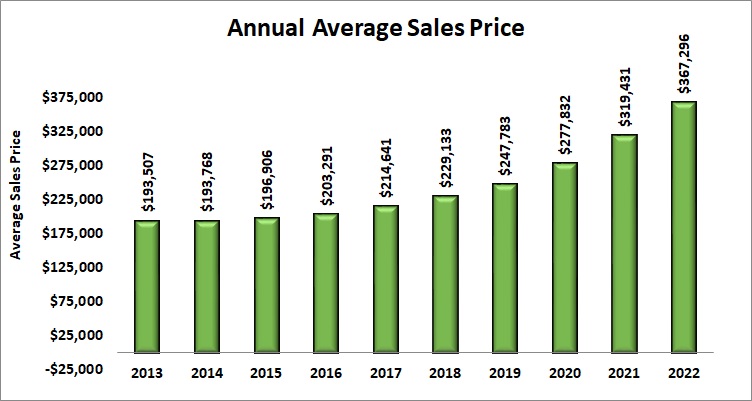
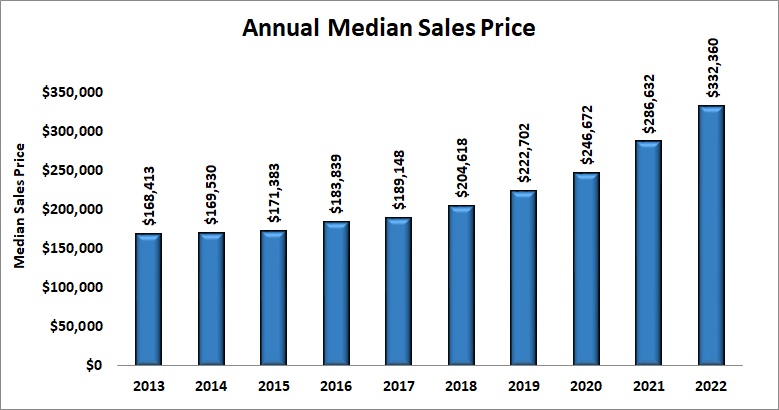
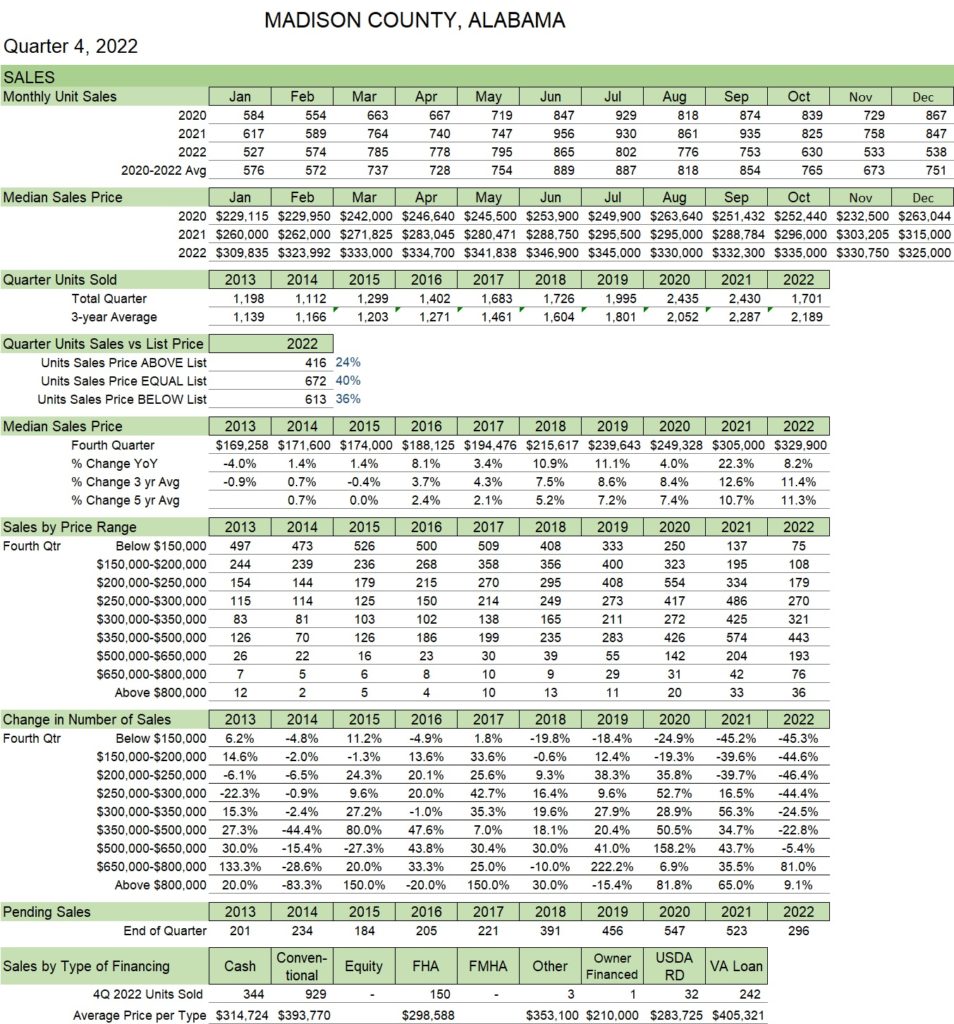
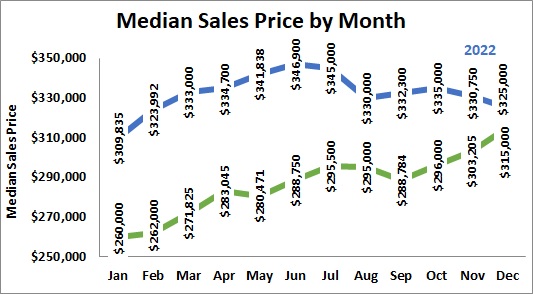
The median sales price of all homes sold grew during the first six months and retreated slightly resulting in an annual median of $332,360. 
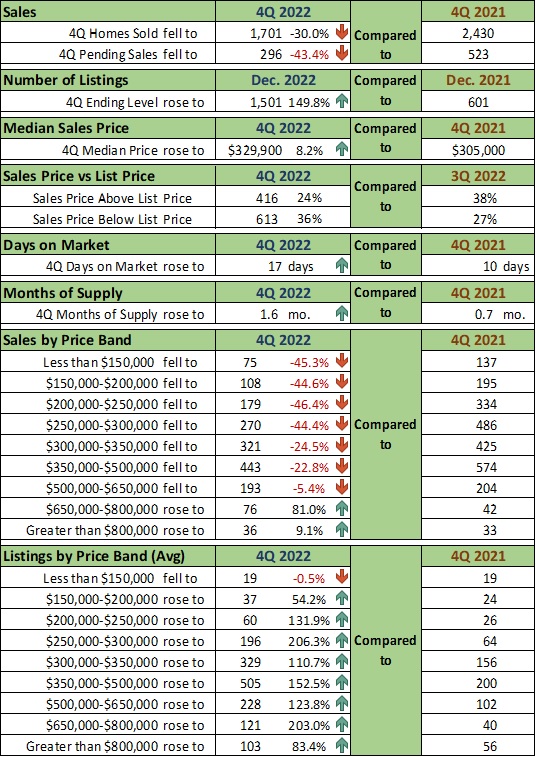
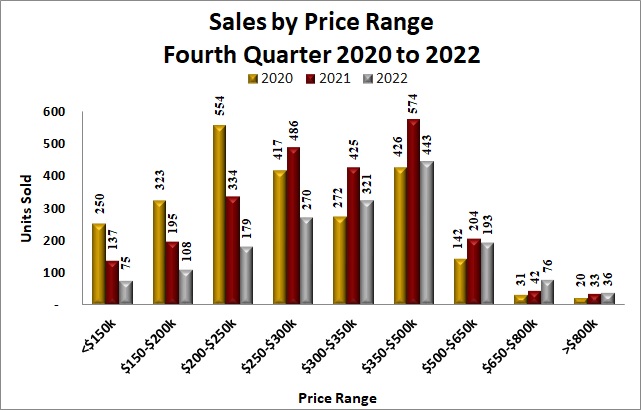
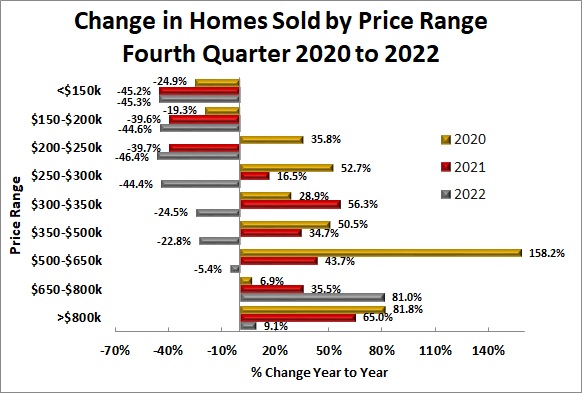
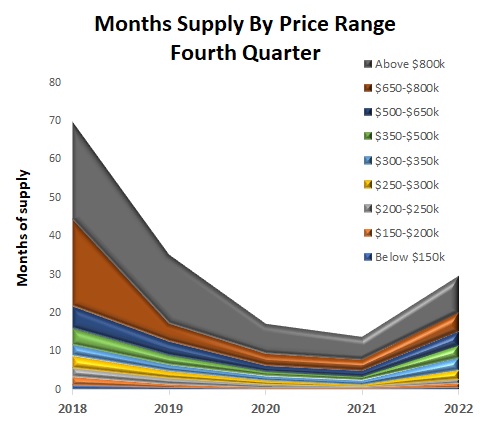
By price band, sales of homes priced below $300,000 fell.  Number of homes sold rose in all price bands above $300,000. Sales of homes priced between $650,000 and $800,000 saw the largest percentage increase at 70%.  The greatest number of homes sold (2,309) were priced between $350,000 and $500,000. 
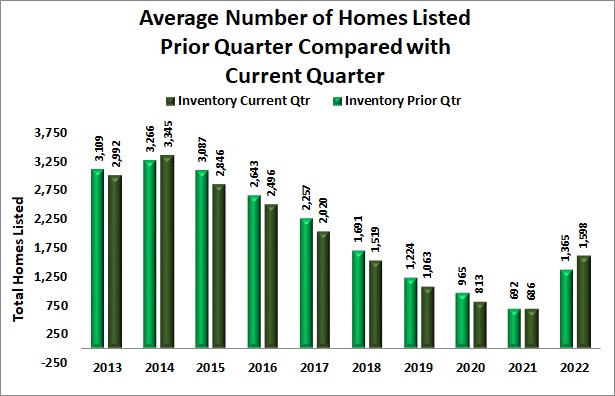
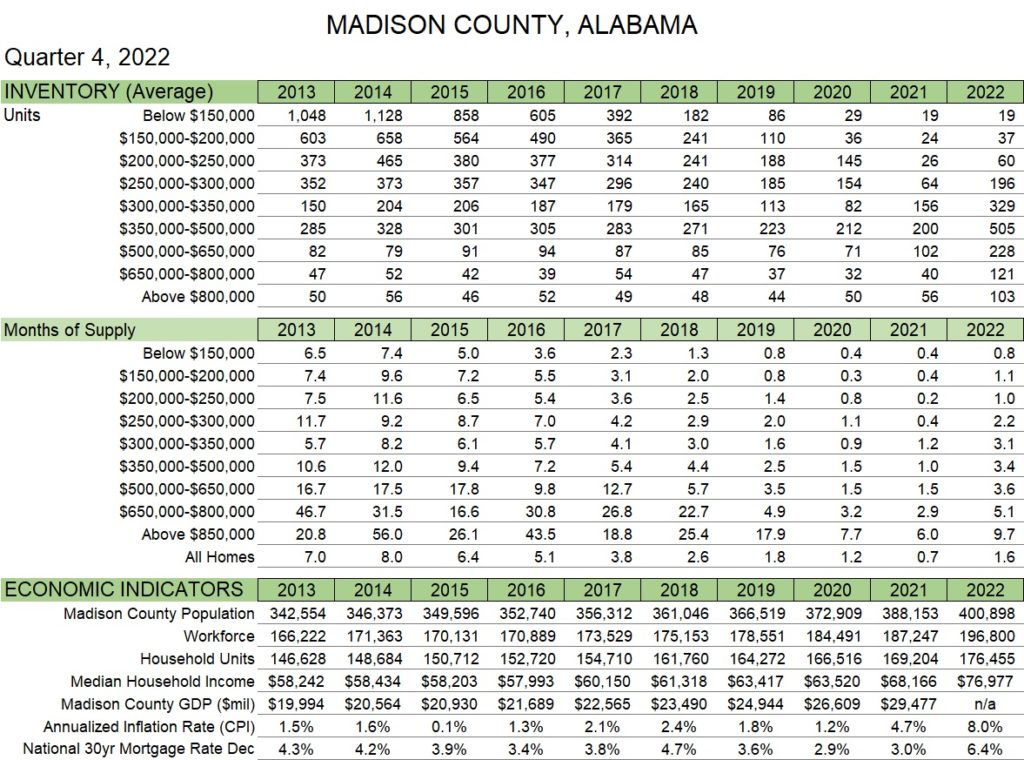
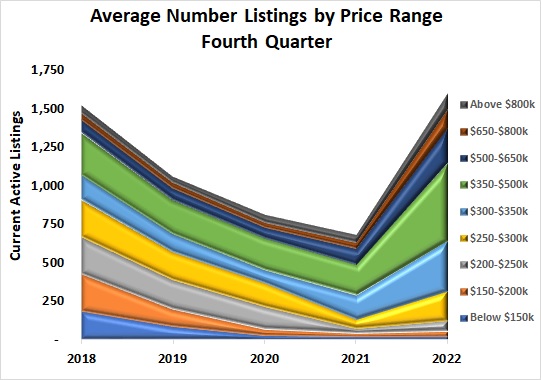
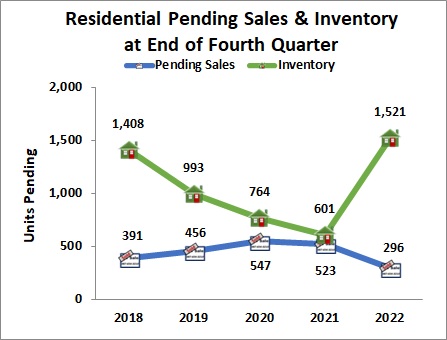
Listings of homes available for sale rose significantly in all price levels above $200,000.  The largest average number of homes listed for the year was for homes priced between $350,000 – $500,000.  See Table 1.

UNITS SOLD

The total number of residential units sold in 2022 (8,356) was 30% below the 2021 level.  This was the first drop in the annual number of units sold since 2014.  See Figure 2.
Figure 2

PRICE

Sale price levels in 2022 continued their rise reaching an average price of $367,296 and a median price of $332,360.  The annual average sales price rose 15% above 2021.  Median sales price was up 16%.   Since 2013, the average sales price increased 90%.  See Figure 3.
Figure 3
The median sales price represents the price point at which about 4,178 homes sold at a lower price and 4,178 homes sold at a higher price in 2022.  Annual median levels rose in each year of the past decade, up 97% since 2013.  See Figure 4.
Figure 4

AVERAGE DAYS ON MARKET

Number of days-on-market (DOM) is a measure of the length of time a home is listed for sale.  In 2022, the annual average days-on-market remained about the same as 2021 at 12.1 days. This level is more than 100 days less than the peak of 2014.  See Figure 5.
Figure 5

SALES & INVENTORY

Home sales for the year totaled 8,356 with the monthly peak occurring in June.  The total number of monthly sales exceeded the average number of listed homes in the first four months.  In May, the inventory of homes grew rapidly and remained above sales levels the remainder of the year.  The average inventory peaked in November at 1,637 homes.  See Figure 6. 
Figure 6
Total pending sales peaked in April at 678, 125 units below the 2021 April pending sales level of 803.  December pending sales (296) was the lowest  level since January 2018.

2022 SUMMARY

The value of residential real estate sales in Madison County, Alabama continued to grow even with a reduction in the number of units sold.  Inventory of listed homes began to recover beginning in the spring to reach a level exceeding monthly sales for the last eight months of the year. 
Home prices rose in the first six months and began to moderate in July but remained above 2021 levels.   The number of units sold declined for all homes priced below $650,000 with the greatest percentage increase in units sold occurring in the $650 – $800,000. 
While the future is unknown; home sales should remain strong but may continue to moderate in the new year.  Increasing levels of available homes suggest that buyers should not only have more to choose from but could enjoy more moderate prices.  The elevated overall inflation rate of 8% in 2022 was challenging homebuyers and homeowners.  The Madison County Real Estate market is facing headwinds, but the strength of the local economy should support the momentum of residential real estate at least in the near future.

2022 Q4 REPORT

INDUSTRY INSIGHTS

  • Home prices moderated in the 4Q with the median price of $329,900, down from the 3Q level of $336,000.
  • Inventory of homes increased significantly during the quarter with the number of homes available remaining above the number of units sold.
  • Percentage of homes in the lower price ranges was smaller for both the number sold as well as the number available in the inventory of homes.
  • The greatest number of listed homes at year-end (459) was in the $350-$500,000 range.
     
Home prices (median) grew in the first half of the year to new record level of $346,900 but began to moderate settling at $325,000 at year end. The green dashed line in Figure 7 below shows the 10-year price trend with the green columns indicating the annual median price change year-over-year. Compared to the overall inflation rate (red lines), home prices rose faster than other cost of living components from 2016 through 2021.
The total inventory of homes listed for sale (green columns in Figure 8) declined 3Q to 4Q each year from 2014 until 2020. The number of available homes stablized in 2021 and began to climb in 4Q 2022.
Days-on-market average for 4Q (17) rebounded from the record low of 10 days in 2021 4Q. While not back to the 2020 level of 20 days, it is only 16% of the 2014 high of 106 days.
The number of newly constructed homes sold in 4Q 2022 (564) was slightly below the 3Q level of 649 and 80% of the 709 in 4Q 2021. The inventory of newly constructed homes in December (858) was more than double the level at 2021 year end (356). Changes in any number of factors such as mortgage rates, construction materials cost, availability of rental properties, etc., could alter the momentum of the residential real estate market in Madison and surrounding counties.
Figure 7
Figure 8

Q4 MARKET SNAPSHOT

  • The Madison County residential real estate market sales moderated in 4Q.
  • Number of homes available at the end of 4Q rose 150% above 4Q 2021.
  • Median sales price 4Q rose to $329,900, an increase of 8% above 4Q 2021 level of $305,000.
  • Number homes sold (1,701) was 30% below the 4Q 2021 total of 2,430. (Table 2)
Table 2

Q4 METRICS

• 4Q 2022 sales level (1,701) was down 701 units from the 4Q peaks in 2021 and 2020, and 22% below the 3-year 4Q average.
• Median monthly sales price fell in each month of the quarter to $325,000 in December.
• 76% of homes sold in 4Q 2022 sold for a price at or below the listed price.
• 20% of homes sold for cash compared to 55% of homes financed conventionally. See Table 3
Table 3
Table 4

Q4 METRICS CONTINUED

• Home listings began to rise midyear 2022 with the 4Q average up 17% from 3Q 2022. (Figure 9)
• Inflation surged to 7.2% in 4Q and median home prices rose 8.2% from 4Q 2021. (Figure 10)
Figure 9
Figure 10

Q4 METRICS CONTINUED

  • Total units sold 4Q was 1,701 which is close to the 2016 and 2017 levels. (Figure 11)
  • The 4Q median sales price of homes sold ($329,900) set another record level. (Figure 12)
  • Median sales price peaked in June at $346,900 and pulled back in the second half of 2022. (Figure 13)
Figure 11
Figure 12
Figure 13

Q4 METRICS CONTINUED

  • The greatest number of homes sold (443) in 4Q was in the $350-$500,000 price range but was below the 4Q 2021 level of 574. (Figure 14)
  • The number of homes available rose in all price ranges with the largest number increase occurring $350-$500,000 range and in the $250-$350,000 range on a percentage basis. (Figure 15)
  • The greatest percentage increase occurred in homes priced above $650,000. Number of homes priced below $650,000 declined compared to 2021.  (Figure 16)
  • The quarterly average number of listed homes rose to 1,598 in 4Q from the 3Q level of 686, the lowest average in more than an decade. (Figure 17)
Figure 14
Figure 15
Figure 16
Figure 17

Q4 METRICS CONTINUED

  • Average Days-on-Market in 4Q ticked up to 17 days from the record low 10 days in 4Q 2021. (Figure 18)
  • The quarterly number of homes pending sale (523) in 4Q dropped to 296, the lowest 4Q level since 2017 (221) while the inventory level rose sharply to 1,521 at the end of December. (Figure 19)
  • With the increase in inventory, the months-of-supply of homes available rose in every price range in 4Q 2022. (Figure 20)
  • The 8-quarter trend for sales and inventory levels suggests 1Q 2023 total sales could be in the 1,700 range with the inventory of available homes remaining around 1,500 units. (Figure 21)
Figure 18
Figure 19
Figure 20
Figure 21

MADISON COUNTY ECONOMIC INDICATORS

• The most recent estimate of Madison County population exceeds 400,000 for 2022. (Figure 22)
• Madison County workforce grew to 196,800 in December 2022. (Figure 22)
• Median Household Income continued to rise reaching an estimated $78,386 in 2021. (Figure 23)
• The number of household units grew to 176,455 in 2022. This represents all types of housing units comprised of nuclear families, extended families, individuals living alone as well as unrelated roommates. The number of housing units should move in relation to population trends. (Figure 24)
• Gross Domestic Product (a monetary measure of the market value of all the final goods and services produced in a specific time period) for Madison County rose to $29.5 billion in 2021, the most recent estimate available. (Figure 25)
Figure 22
Figure 23
Figure 24
Data Sources:
  • Alabama Department of Labor
  • Huntsville Area Association of Realtors Monthly Housing Statistics Reports
  • Federal Reserve Bank of St. Louis
  • S. Bureau of Economic Analysis
  • S. Census Bureau
  • ValleyMLS.com
Figure 25
Analysis & Report Prepared by:
  • Jeff Thompson, Project Director
  • Brinda Mahalingam, Ph.D., Economist
  • Karen Yarbrough, Editor
Questions regarding this report may be directed to: Jeff Thompson, jeff.thompson@uah.edu, 256.361.9061