The Madison County Residential Real Estate Market in the 3rd Quarter 2022 saw a significant rise in inventory and moderation in the rise of the median sales price.
The inventory of homes rose 42% in 3Q 2022 from the 2Q ending level and increased 95% from the 3Q 2021 total.
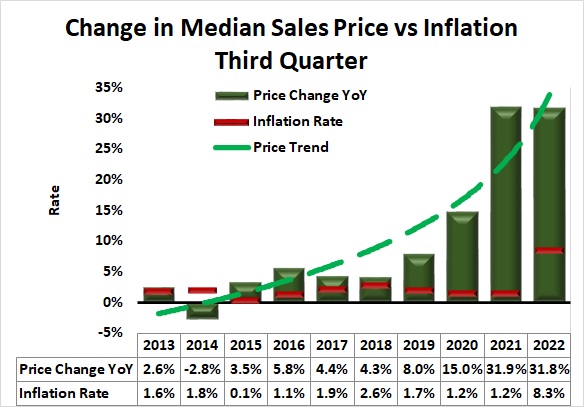
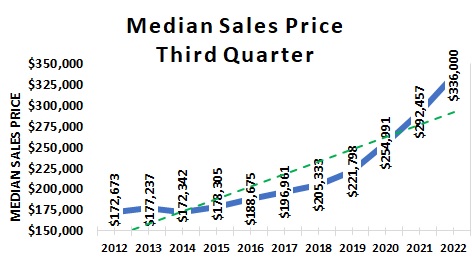
The median sales price for 3Q (336,000) was 14.9% above the 3Q 2021 median sales price but down 1% from the 2Q 2022 level.
Thirty-eight percent of homes sold above list price this quarter while 35% sold at the asking price. The number of sales below asking price rose to 27% from 15% in 2Q 2022.
Market balancing continues driven by multiple factors including:
The consumer inflation rate remained elevated at 8.2% in September.
National average 30-year mortgage rates have more than doubled from 2021 to 6.7% as of September 2022.
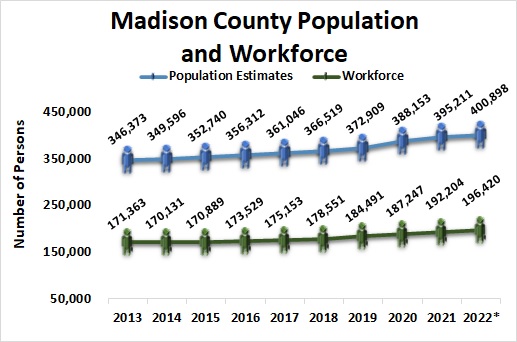
Madison County population now exceeds 400,000 and the workforce in September totaled 196.420, an increase of 4,200 from 2021.
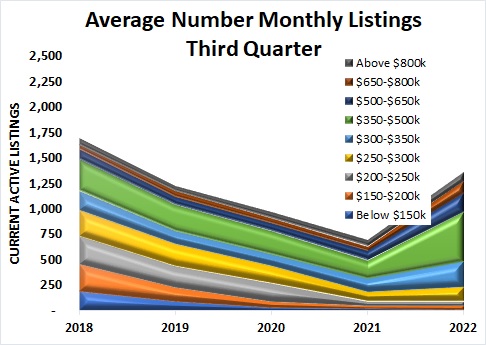
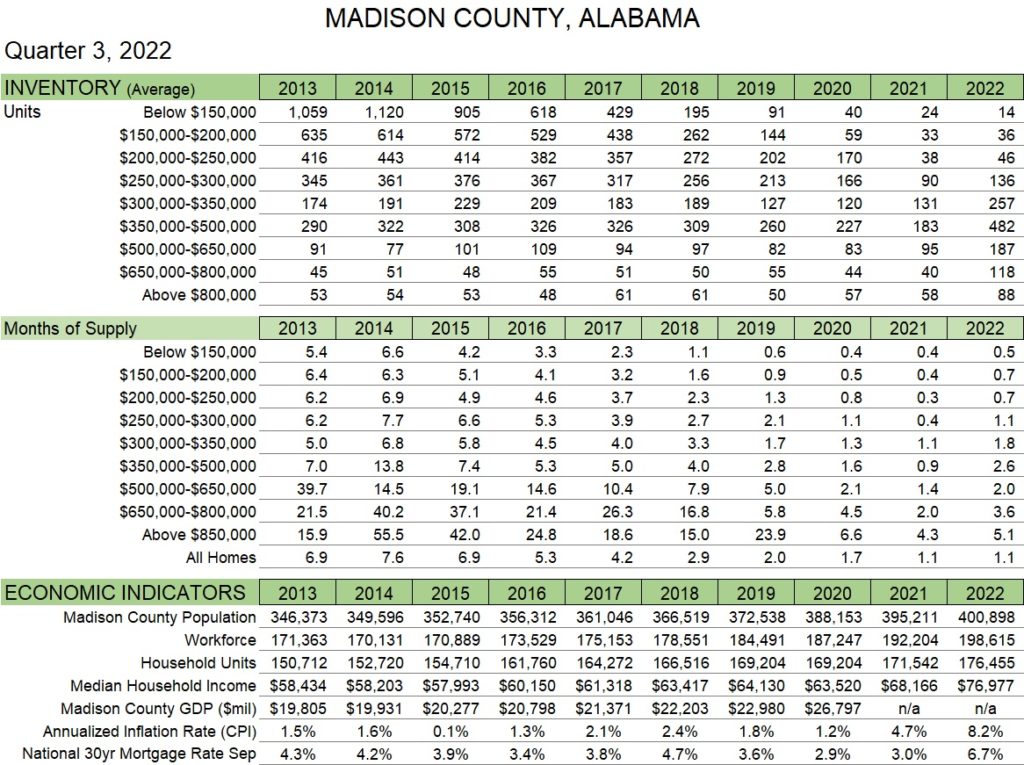
The inventory of homes listed for sale rose significantly for a sixth consecutive month to 1,496 listings at the end of September. The 3Q average number of listings was almost twice the 2021 level. The greatest increase and number of 3Q listings were both in the $350-$500,000 price band (green band in Figure 1) which aligns with the price range of the most homes sold this quarter. Twenty-eight percent of sales this quarer were newly constructed. Months of supply (1.1 mo.) remained the same as 3Q 2021.
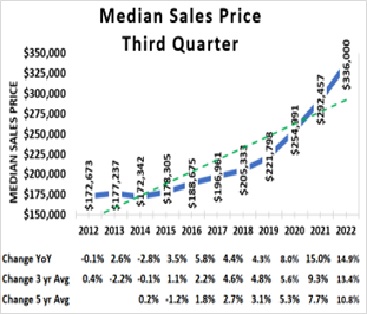
Sales prices continue to be strong with a 3Q 2022 median price of $336,000. This levels is 14.9% above the 3Q 2021 median price and about 1% below the 2Q 2022 median price of $340,701. Homes sold at a price above listing accounted for 38% of total sales compared to 50% in 3Q 2021. The number of sales below asking price rose to 27% compared to 15% one year ago. Figure 2.
In general, availability of homes in Madison County rose signficantly with sales prices remaining strong. The largest number of listed homes was in the price range with the most sales ($350-$500,000) which suggests improving alignment of supply and demand. The largest challenge may no longer be the availability of homes but a high consumer price inflation rate of 8.2% and 30-year mortgage rates exceeding 6%.
Figure 1
Figure 2
Q3 2022 Market Snapshot
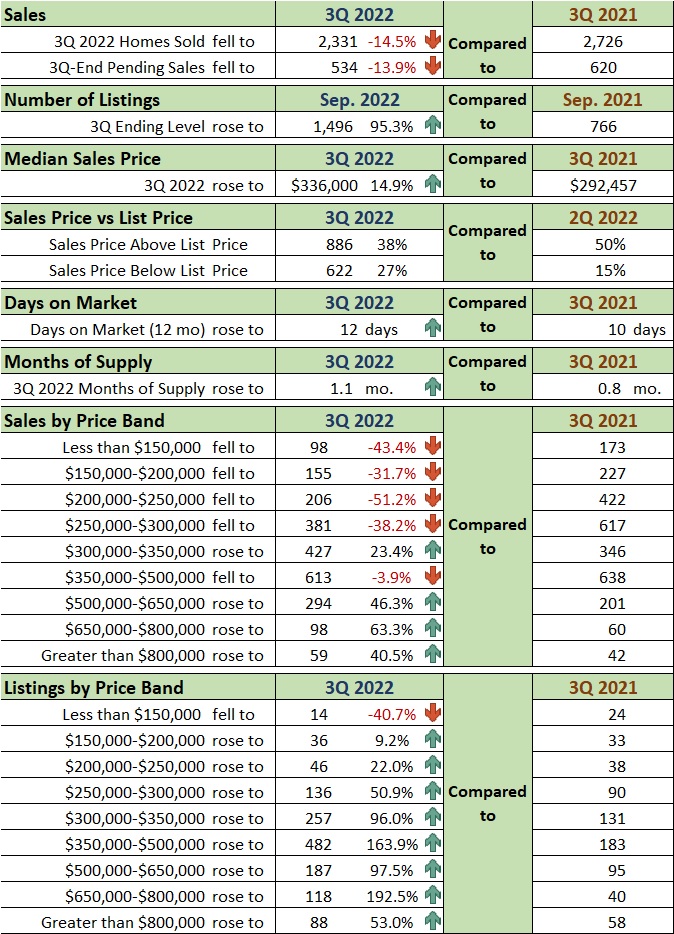
Inventory of homes rose 95% to 1,496 from 3Q 2021 with the largest rise in the $650-$800,000 range.
Housing prices rose 14.9% from 3Q 2021.
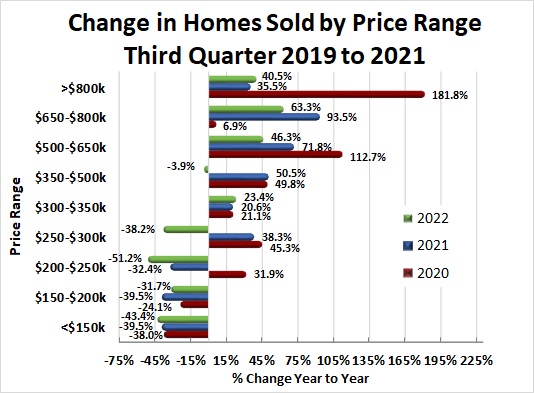
Sale of homes priced between $650,000 and $800,000 rose 63.3% from 3Q 2021. Sales of homes priced below $300,000 continued to fall from 3Q 2021 levels.
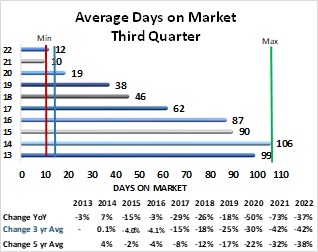
Average days on market increased noticeably to an average of 12 days in 3Q 2022. (Table 1)
Table 1
Q3 2022 Key Metrics
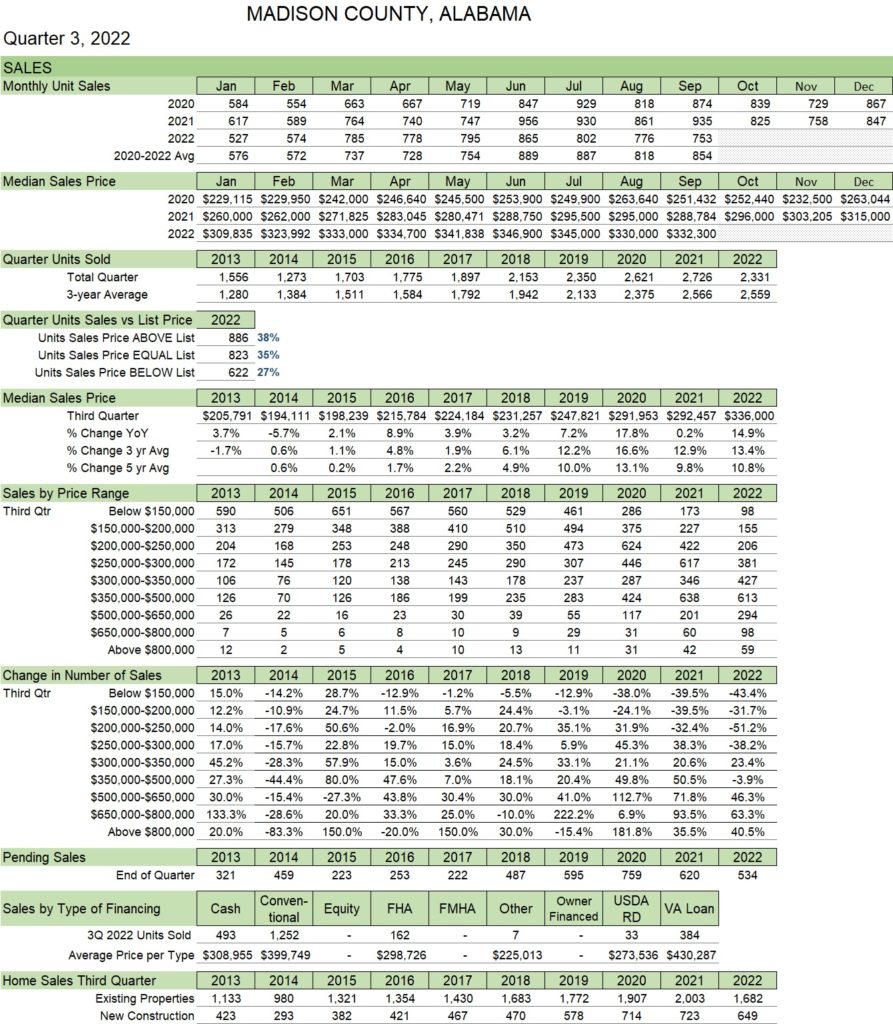
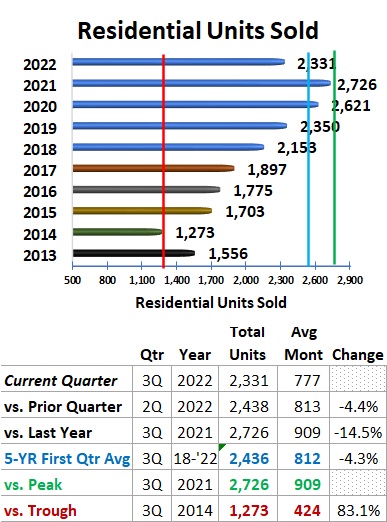
The number of homes sold (2,331) was the lowest 3Q level since 2018 (2,153).
Sales of newly constructed homes remained strong at 649 homes.
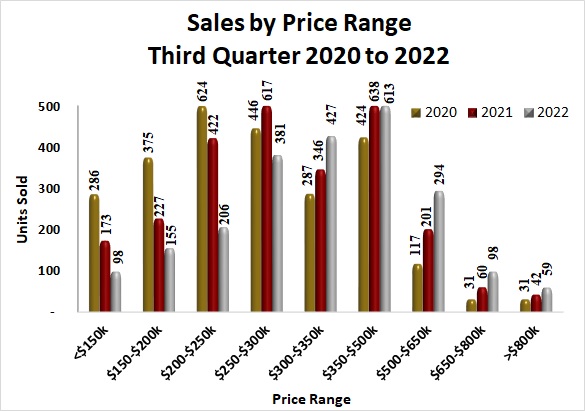
Most homes sold (26%) were in the $350-$500,000 price range. (Table 2)
Table 2
Q3 Metrics Details
The highest level of inventory of homes (482) was in the $350,000-$500,000 price range…which is the range of the most sales in the 3Q.
The average months of supply for homes sold remained at 1.1 months from 3Q 2021.
National 30-year mortgage rate at quarter-end (6.7%) was more than double the 3% rate in 2021.
Madison County population grew to more than four hundred thousand and the workforce grew by 3.3% from the 2021 average through Aug 2022. (Table 3)
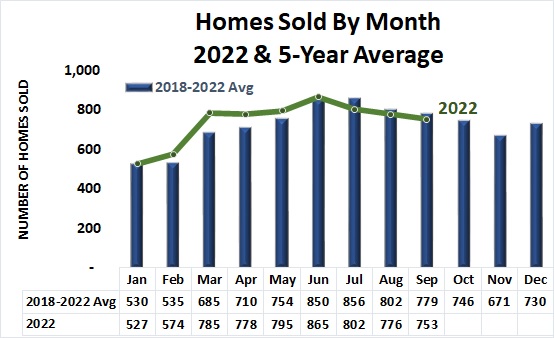
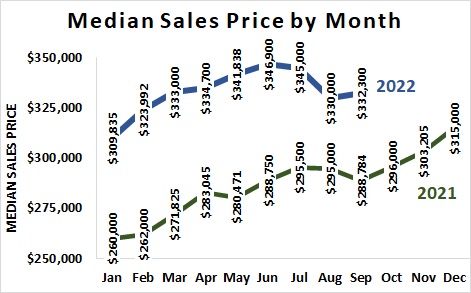
Monthly sales in 2022 were slightly below the 2021 levels for July, August, and September. (Figure 4)
Table 3
Figure 3
Figure 4
Q3 Metrics Details
Total units sold (2,331) was 14% below the 3Q 2021 record level (2,726). (Figure 5)
The home median sales price of the third quarter rose 14.9% to $336,000 from 3Q 2021. (Figure 6)
The monthly median sales price fell in July and August but rose in September to $332,300. (Figure 7)
Figure 5
Figure 6
Figure 7
Q3 Metrics Details
Total 3Q 2022 sales continued to be above 2021 levels for the $300-$500,000 homes compared to 3Q 2021 and 2020. (Figure 8)
The rate of growth remained positive in price bands above $500,000. (Figure 9)
Total number of available homes rose significantly with the $350,000-$500,000 seeing the greatest increase (299). (Figure 10)
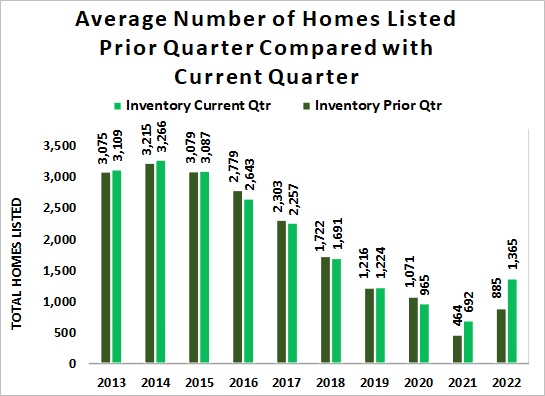
Current quarter average number of listed homes rose to the highest level (1,365) since 2018. (Figure 11)
Figure 8
Figure 9
Figure 10
Figure 11
Q3 Metrics Details
Average Days on Market rose to 12 days compared with 8 days in 2Q 2022 and 10 days in 3Q 2021. (Figure 12)
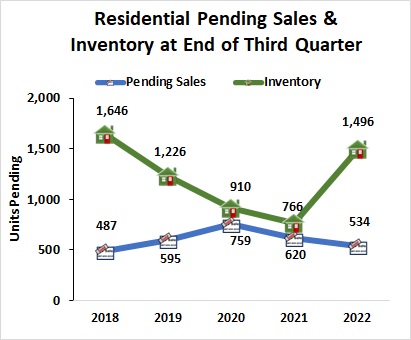
The quarterly number of homes pending sales fell to the lowest 3Q level (534) while the number of listed homes rose to the highest level since 3Q 2018. (Figure 13)
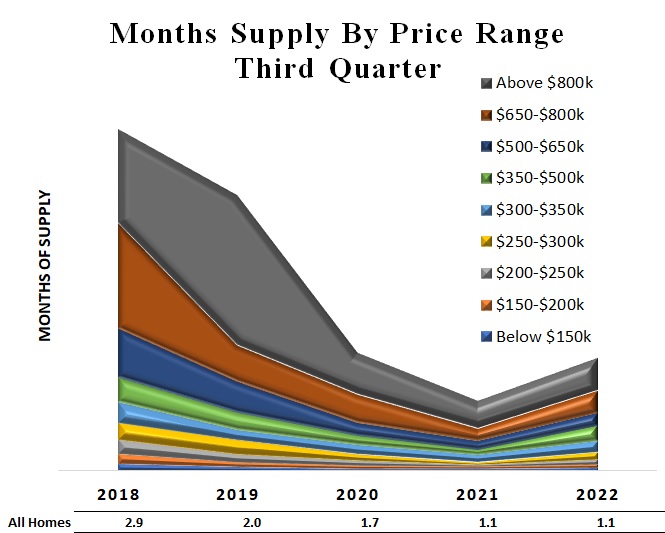
Months-of-supply of homes remains low but rose in all price bands from the 2Q 2022 levels. The highest level of months-of-supply (5.1) occurred in 3Q 2022 for the $800,000-plus priced homes. (Figure 14)
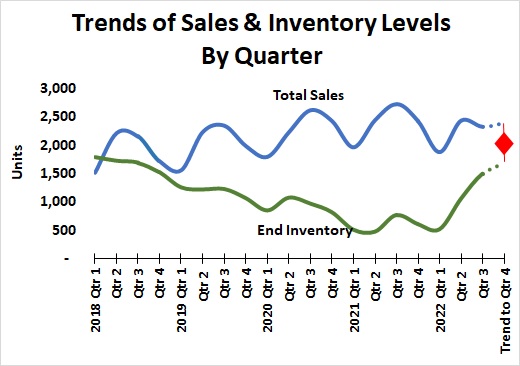
The 23-quarter trend for sales and inventory levels suggests total sales could remain in the 2,400 range in 4Q 2022 while the inventory of listed homes could rise to 1,675 units. To sustain this trend, at least 370 new listings will be needed in 4Q 2022. (Figure 15)
Figure 12
Figure 14
Figure 13
Figure 15
Madison County Economic Indicators
Madison County population grew to an estimated 400,898 as of July 2022. (Figure 16)
Madison County workforce reached 196,420 in September 2022. (Figure 16)
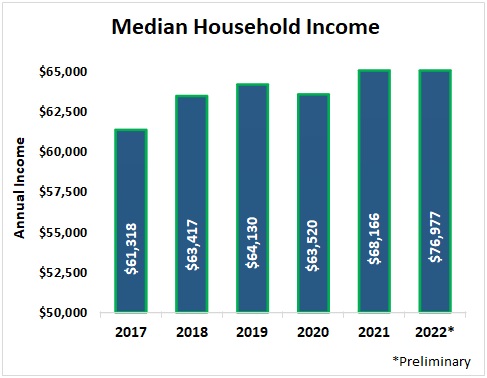
Median Household Income in Madison County rose to $76,977 in 2022 (preliminary). (Figure 17)
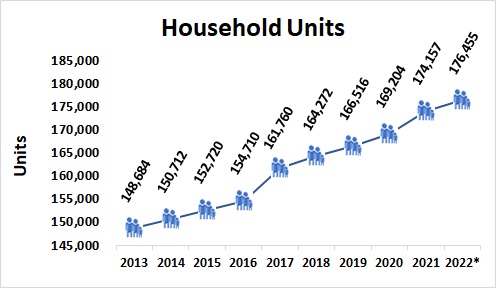
The number of household units grew to an estimated 176,455 in 2022 (preliminary). This represents all types of housing units comprised of nuclear families, extended families, individuals living alone as well as unrelated roommates. The number of housing units normally moves with population. (Figure 18)
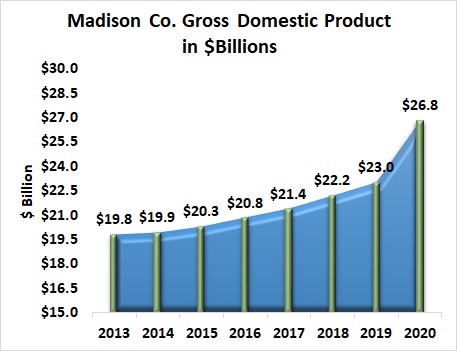
Gross Domestic Product (a monetary measure of the market value of all the final goods and services produced in a specific time period) for Madison County rose 16.5% from 2019 to an estimated $26.8 billion in 2020, the most recent estimate available. (Figure 19)
Figure 16
Figure 18
Figure 17
Figure 19
Data Sources:
Alabama Department of Labor
Huntsville Area Association of Realtors Monthly Housing Statistics Reports
U.S. Bureau of Economic Analysis
U.S. Census Bureau
Valley MLS System
Analysis & Report Prepared by:
Jeff Thompson, Project Director
Brinda Mahalingam, Ph.D., Economist
Dilcu Barnes, Ph.D., Industrial Systems
Karen Yarbrough, Editor
Questions regarding this report may be directed to: Jeff Thompson, jeff.thompson@uah.edu