The Madison County Residential Real Estate Market for 2nd Quarter 2022 continues with high demand and low supply with some balancing in specific price points.
 As a whole, inventory of homes rose 125% in 2Q 2022 with the largest increase in the $300-$350,000 price range while the availability of homes remains below one month.
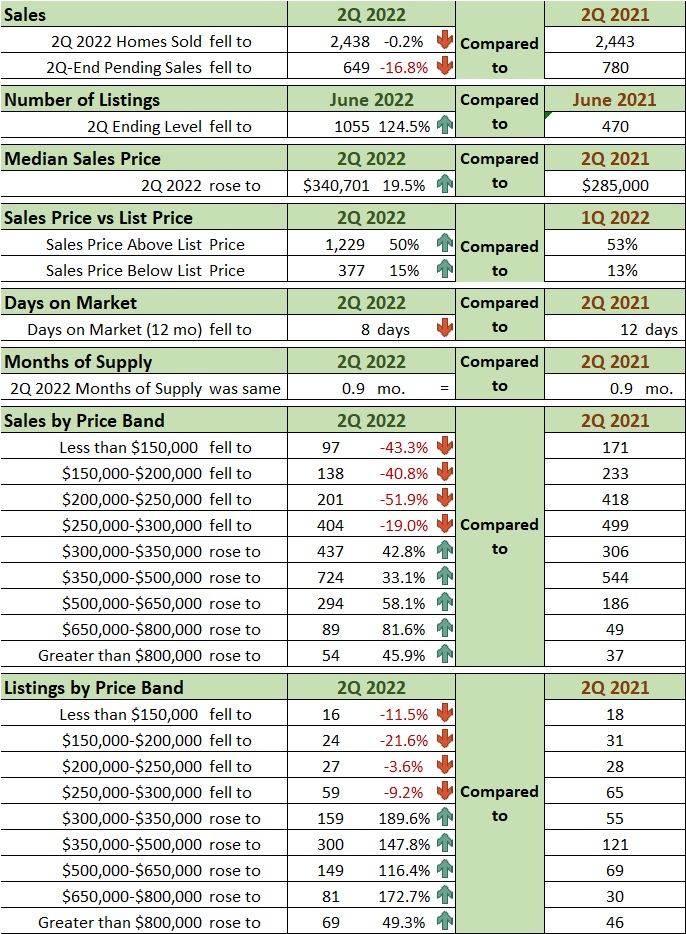
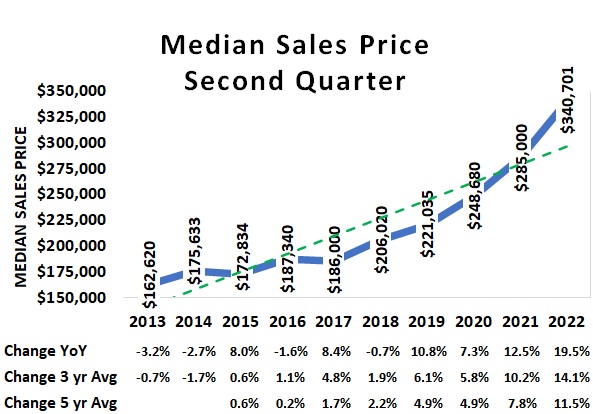
Prices continued to rise reaching a record median sales price level of $340,701.
Fifty percent of homes sold this quarter, sold above list price. This is down slightly from last year where 53% sold above list price.
There are several factors leading toward a more balanced market:
The consumer inflation rate jumped to 9.1% in June, about twice the 2021 annual rate.
National average 30-year mortgage rates rose from 3.10% to 5.34% from the end of 2Q 2021 to 2022.
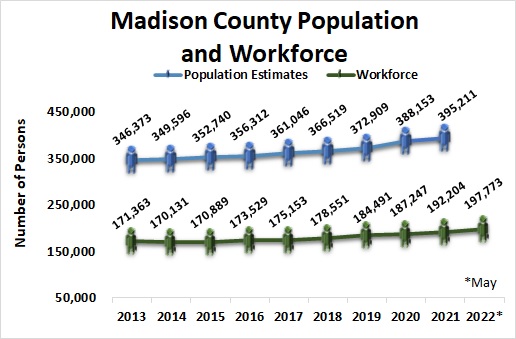
Madison County workforce grew 2.9% from 192,204 in 2021 to 197,773 in 2022.
Inventory of homes rose 125% to 1,055 from 2Q 2021 with the largest rise in the $300-$350,000 range.
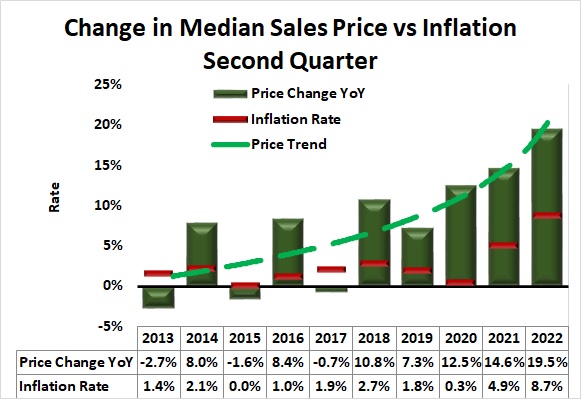
Housing prices continued to rise…up 19.5% from 2021.
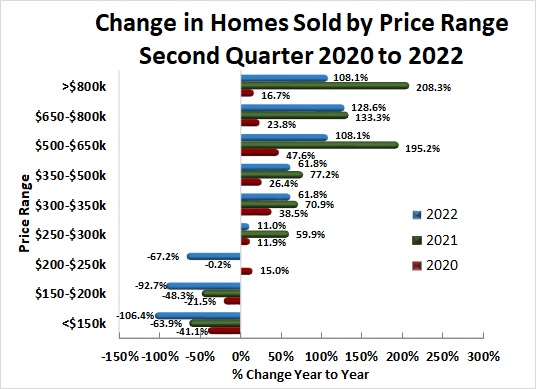
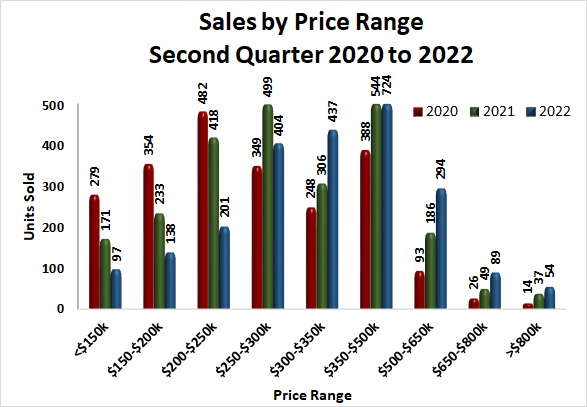
Sale of homes priced between $650,000 and $800,000 rose 82% from 2Q 2021. Sales of homes priced below $300,000 continued to fall from 2Q 2021 levels.
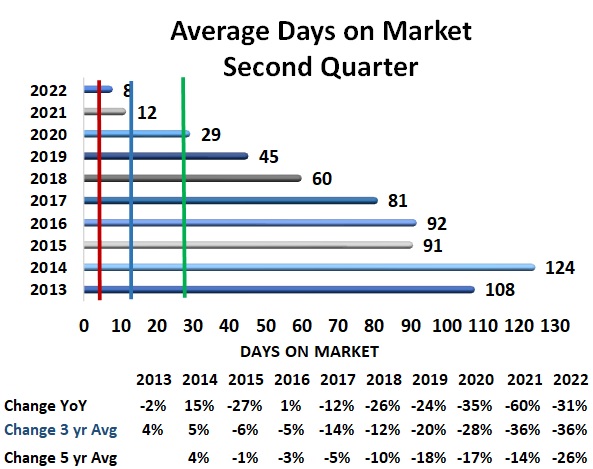
Average days on market remained at record low levels with an average of 8 days in 2Q 2022
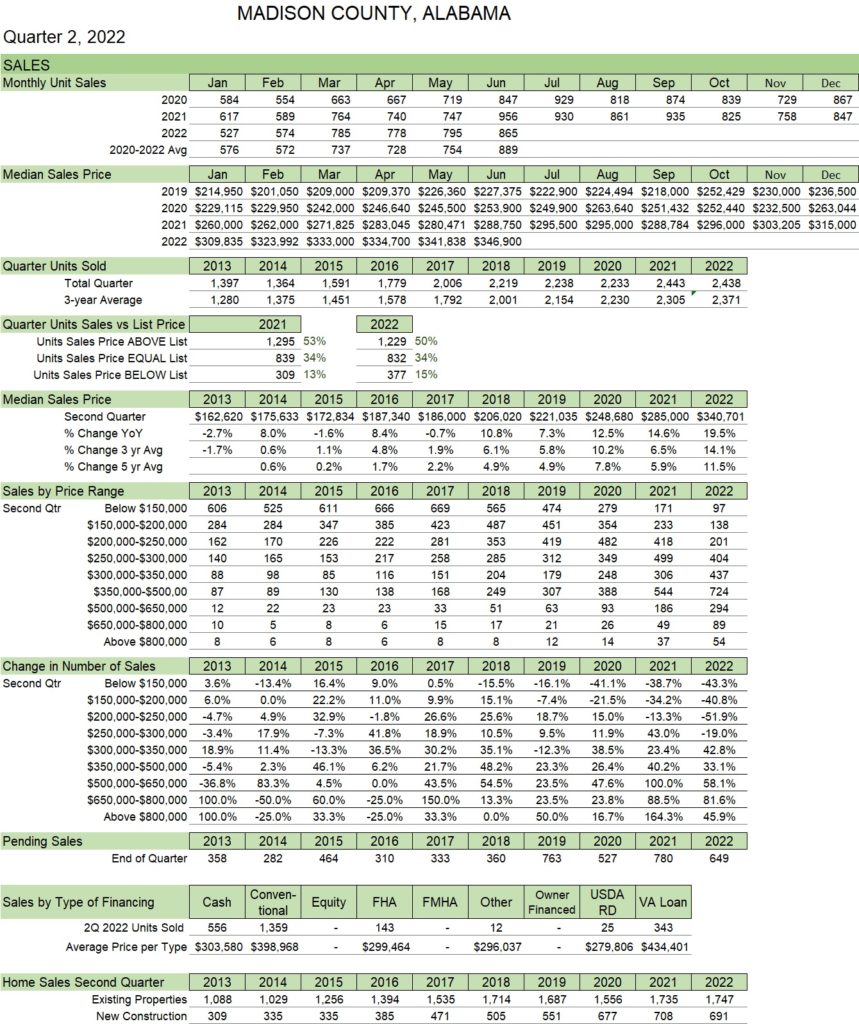
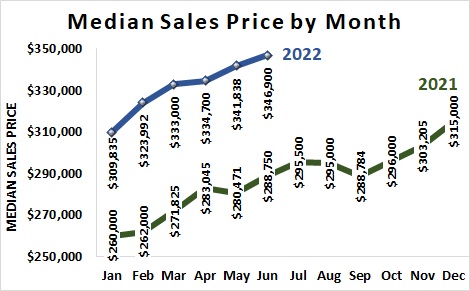
Monthly median sales prices continued to climb to another record of $346,900 in June.
More than half of the second quarter’s sales were an average of 5.2% above the listed price.
Sales of newly constructed homes remained strong at more than 28% of 2Q 2022 sales.
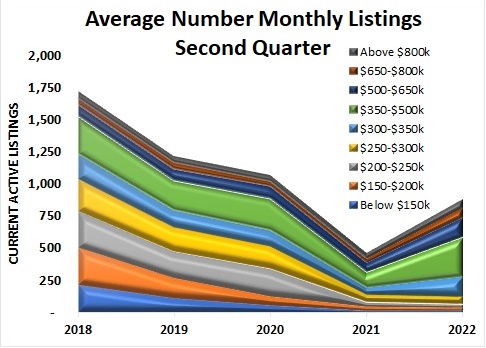
The highest level of inventory of homes was in the $350,000-$500,000 price range.
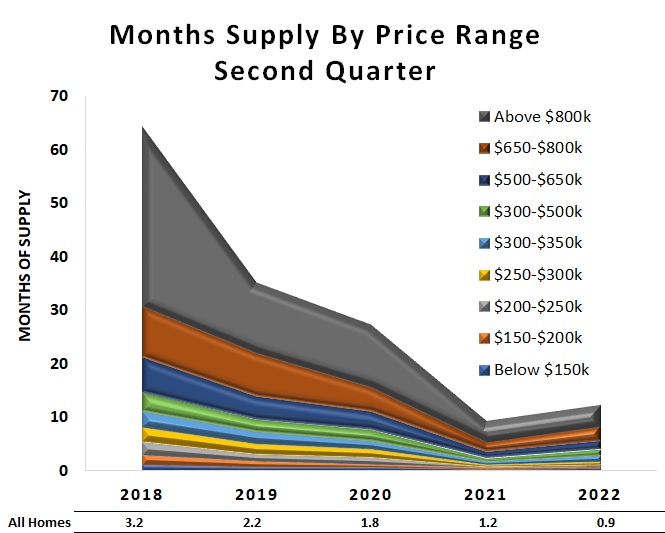
The average months of supply for homes sold continued below 1-month.
Madison County workforce grew by 2.9% from the 2021 average through May 2022.
National 30-year mortgage rates at quarter-end rose from 3.10% to 5.34% from 2021. (Figure 3)
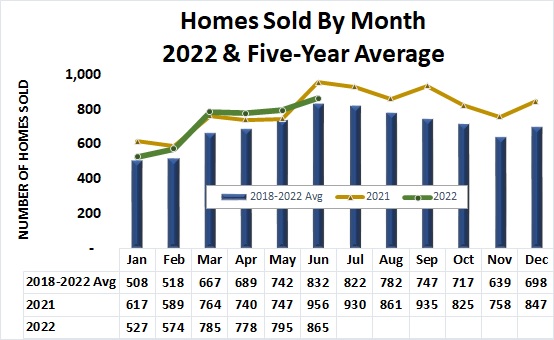
Sales by month in 2022 closely tracked 2021 levels through May but was lower in June. (Figure 4)
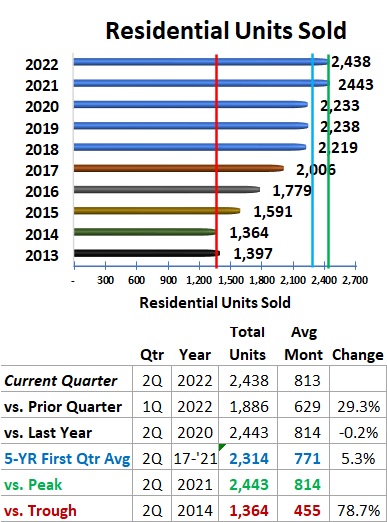
Total units sold of 2,438 continued close to the 2Q 2021 record level (2,443). (Figure 5)
The home median sales price of the second quarter rose 19.5% to $340,701from 2Q 2021. (Figure 6)
The monthly median sales prices for April, May, and June were significantly ($50,000 to $61,000) above the respective months in 2021. (Figure 7)
Total 2Q 2022 sales continued to be higher than the previous two years for homes priced above $300,000. (Figure 8)
The rate of growth slowed in every price band for 2Q 2022 compared with 2Q 2021. (Figure 9)
Total number of available homes rose significantly with the $350,000-$500,000 seeing the greatest increase. (Figure 10)
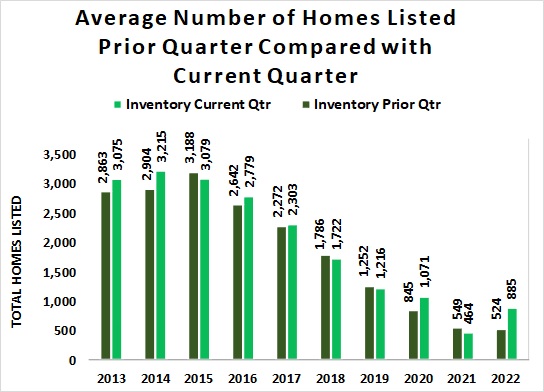
Current quarter compared to prior quarter average number of listed homes saw the largest rise in inventory in more than ten years. (Figure 11)


Average Days on Market fell 31% to a record low of 8 days in 2Q 2022. (Red line Figure 12)
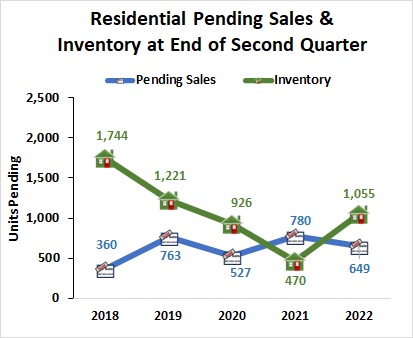
The quarterly number of homes pending sale fell from 2Q 2021 to 634 homes while the number of listed homes rose to the highest level in three years for 2Q 2022. (Figure 13)
Months-of-supply of homes remain at low levels across all price ranges but rose slightly for homes priced above $300,000. (Figure 14)
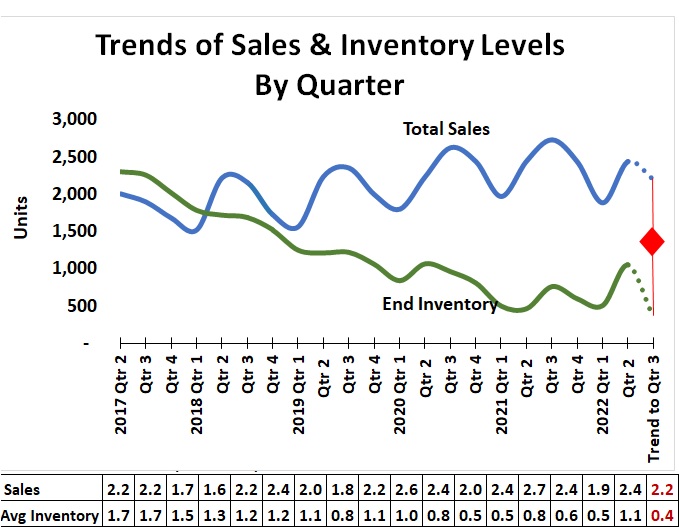
The 21-quarter trend for sales and inventory levels suggests total sales could remain in the 2,200 range in 3Q 2022 while the inventory of listed homes could fall to below 500 units. To sustain this trend, at least 700 new listings will be needed in 3Q 2022. (Figure 15)
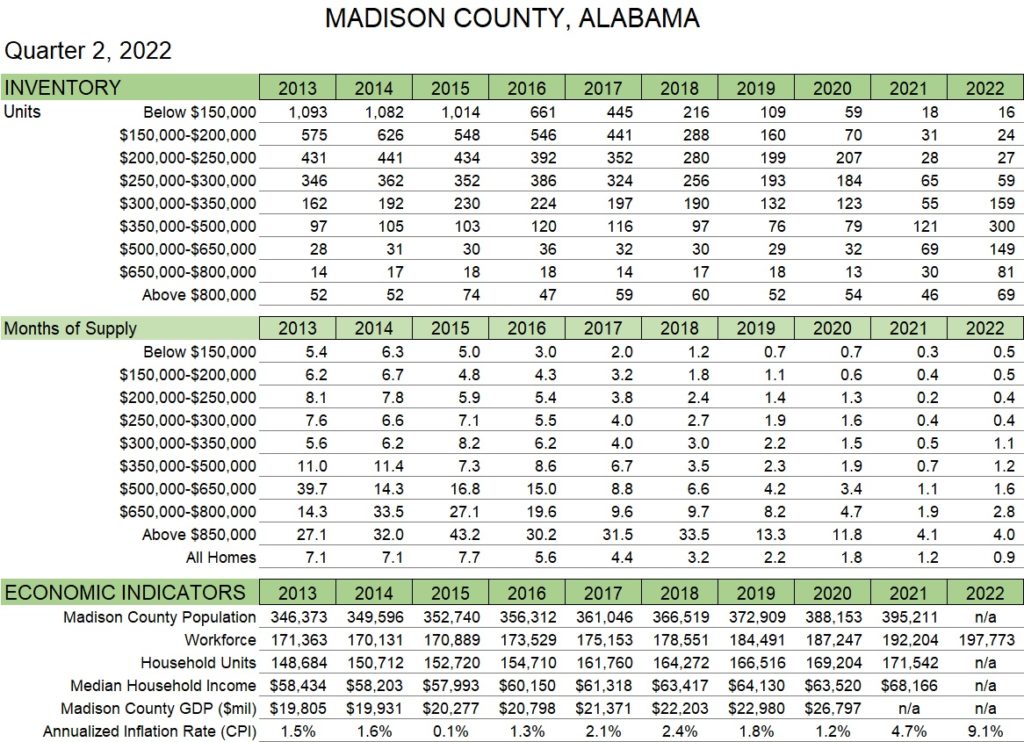
Madison County population grew to 395,211 in 2021. (Figure 16)
Madison County workforce reached 197,773 in May 2022. (Figure 16)
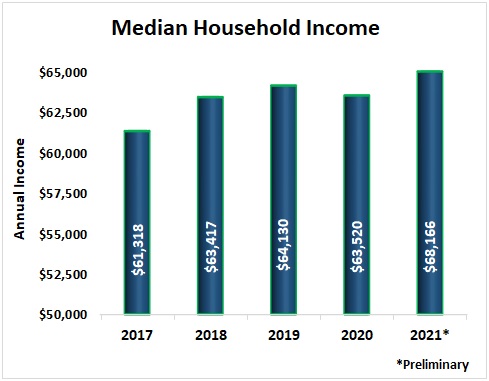
Median Household Income in Madison County rose to $68,166 in 2021, significantly above the pre-pandemic level. (Figure 17)
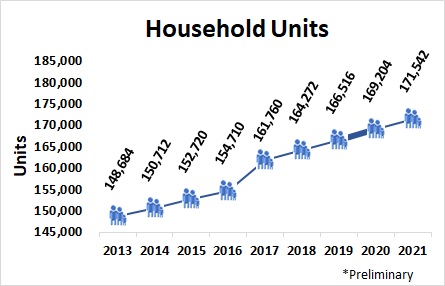
The number of household units grew to an estimated 171,542 in 2021. This represents all types of housing units comprised of nuclear families, extended families, individuals living alone as well as unrelated roommates. The number of housing units normally moves with population trends. (Figure 18)
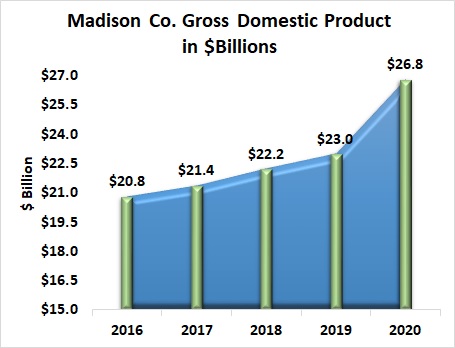
Gross Domestic Product (a monetary measure of the market value of all the final goods and services produced in a specific time period) for Madison County rose 16.5% from 2019 to an estimated $26.8 billion in 2020, the most recent estimate available. (Figure 19)