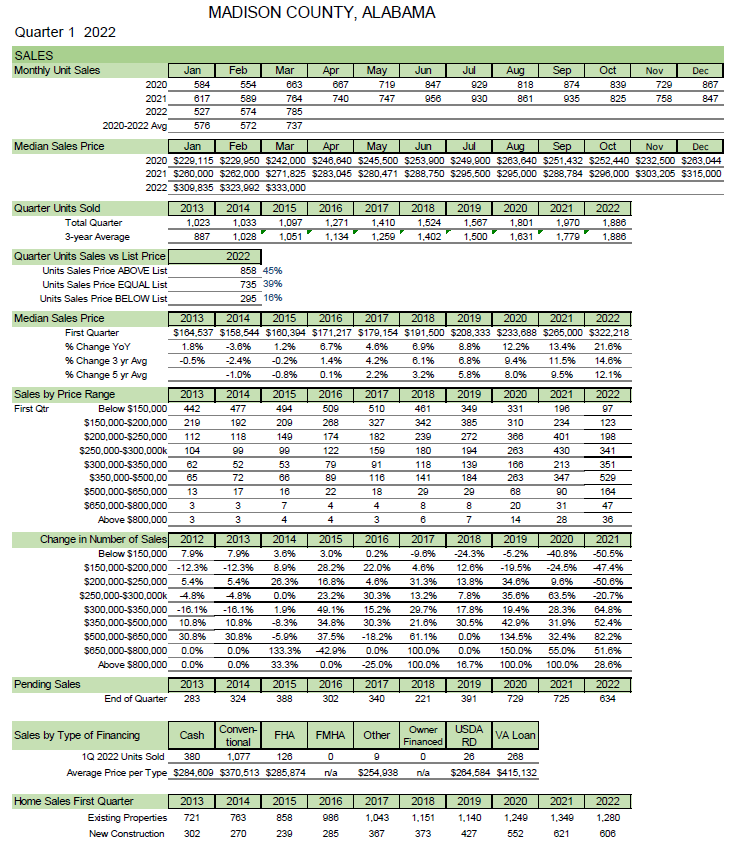
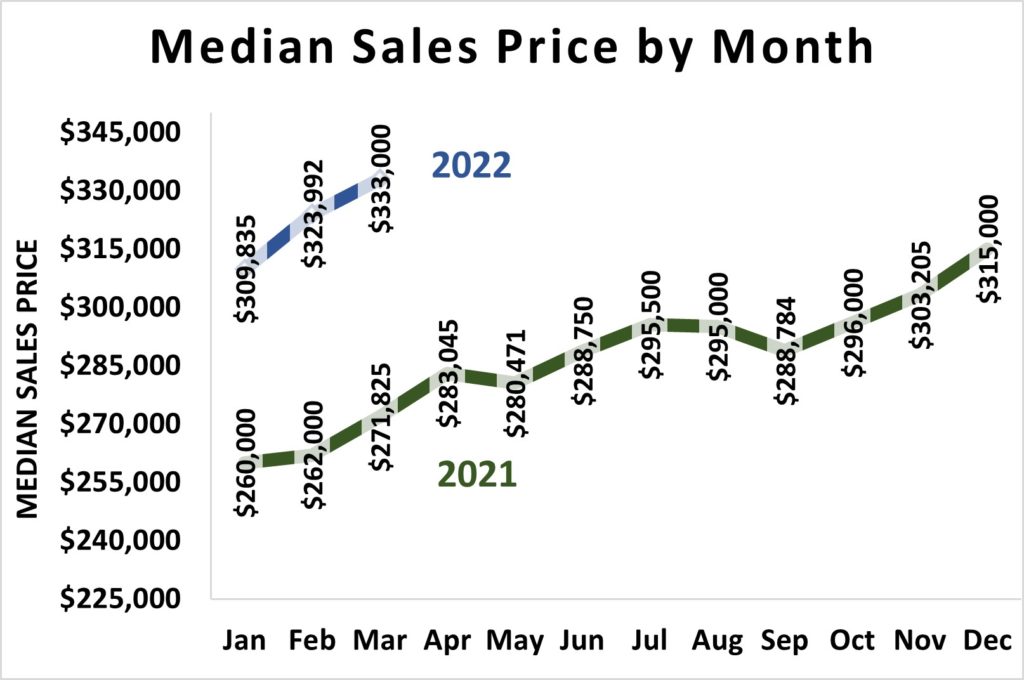
🏡 Median sales price rose to a record level of $333,000 in March 2022.
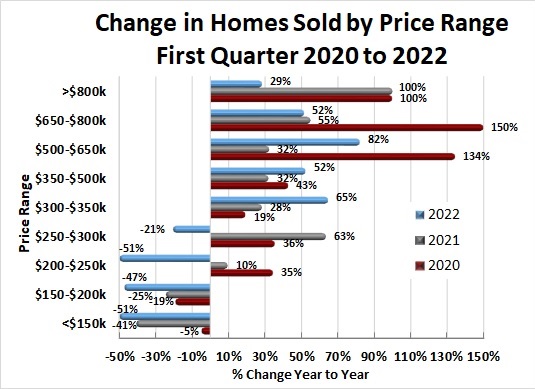
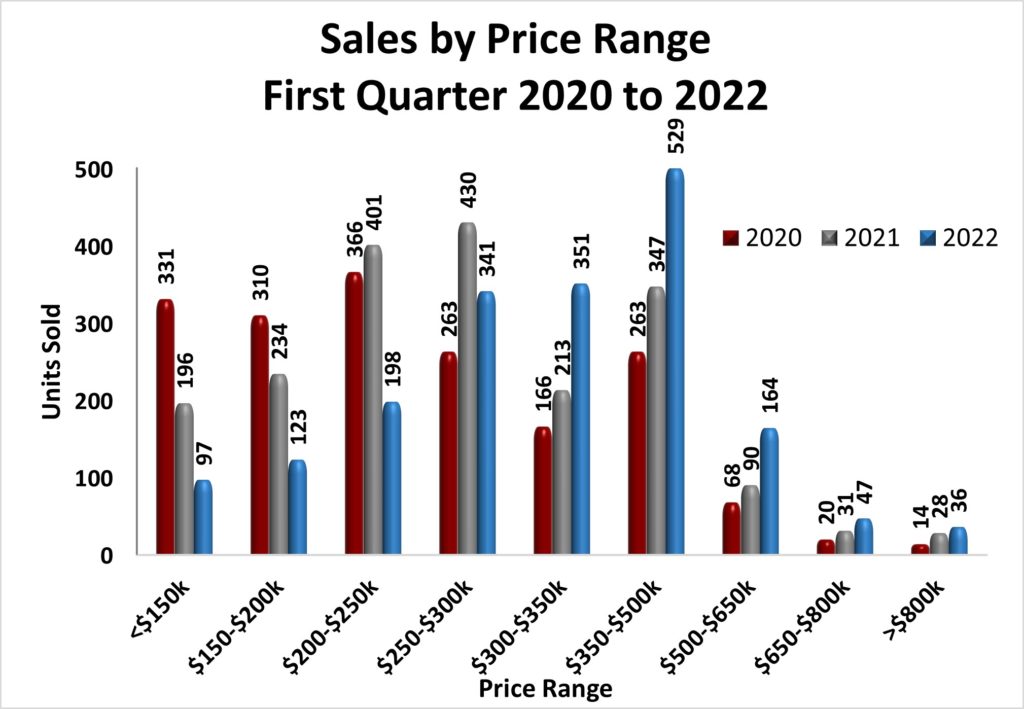
🏡 Sales of homes priced between $500,000 and $800,000 more than doubled while the number of homes priced below $200,000 have fallen for three years.
🏡 Forty-five percent of homes sold this quarter were at a price above list price.
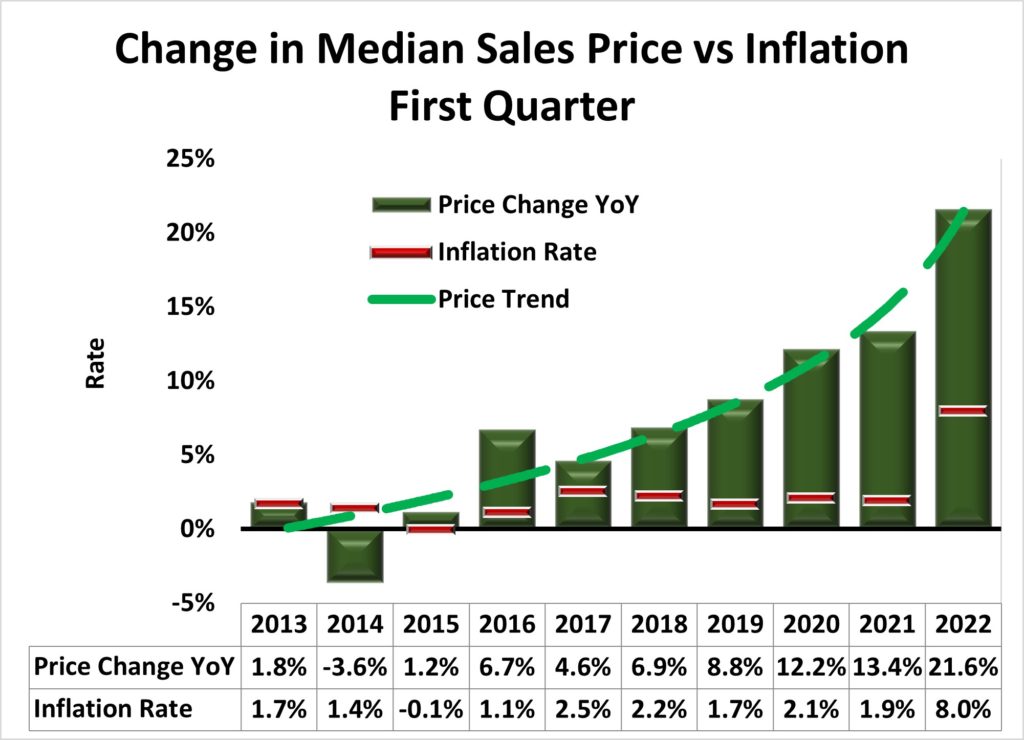
🏡 The consumer inflation rate jumped to 8% in March, more than four times the 2021 level.
Executive Overview
The first quarter of 2022 brought major price increases in not only home prices but also in the overall cost of living. The number of homes sold remained at elevated levels compared to the level of inventory of listed homes. Homes priced above $300,000 accounted for 60% of all homes sold and 82% of all listed homes. The number of homes sold priced above $350,000 continued to grow.
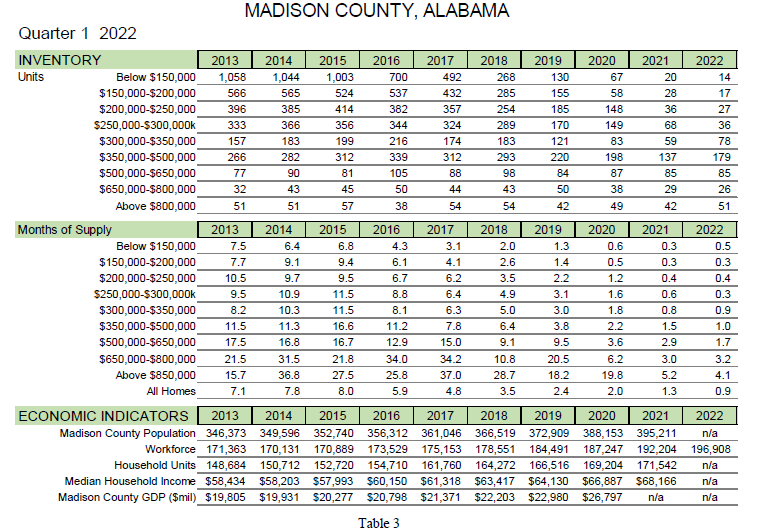
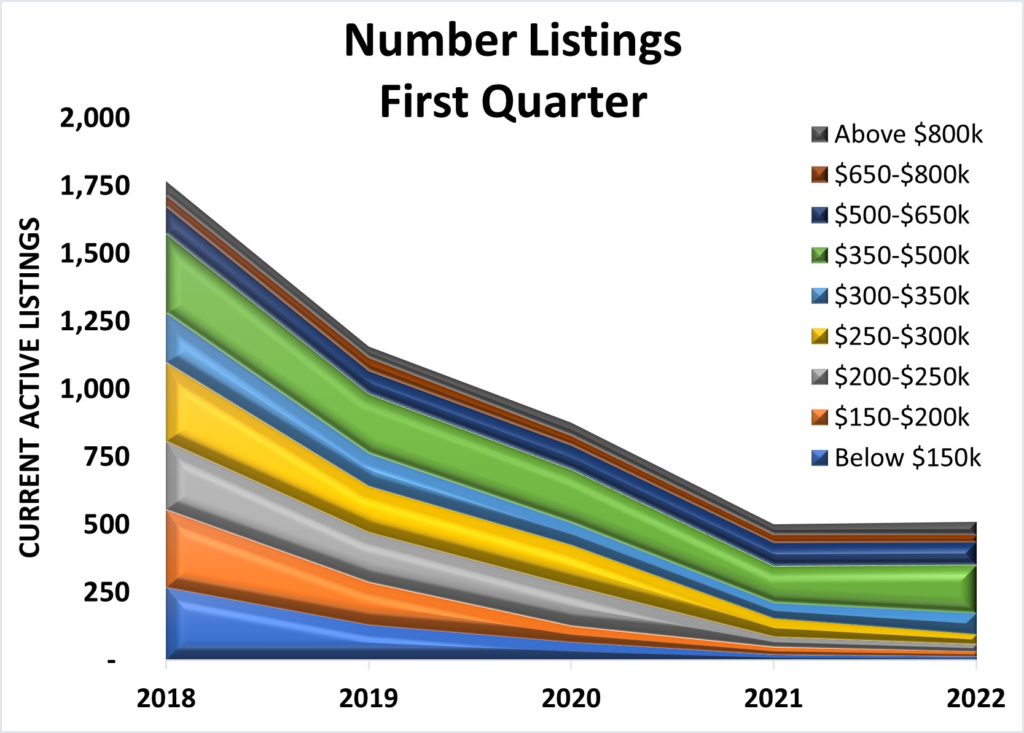
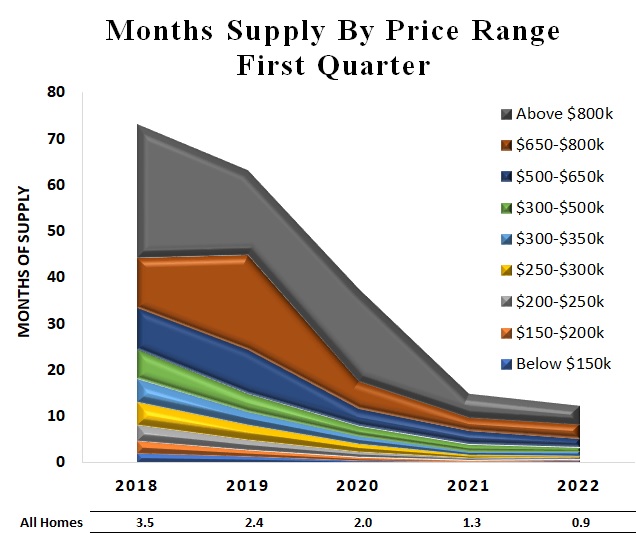
The number of listed homes has remained below 1,000 in total for twenty consecutive months. In 2022, the inventory of homes priced below $300,000 fell while homes priced in the $200,000 to $300,000 fell for the first time in the quarter one. See Figure 1.
Figure 1
Figure 2
Sales of homes priced below $250,000 fell by almost 50% compared to 1Q 2021 sales. The Days-on-Market dropped to an average of 9 days in March…only slightly above the 8 days-on-market for September and October 2021. The 2022 first quarter average days on market was 11 days.
Overall, home prices in Madison County continue to rise with demand for housing exceeding supply even with a rise in cost of living. The jump in consumer price inflation rate of 8% and the 21.6% increase of the first quarter median home price far exceeds the 2% increase in median household income for 2021.
The budget shock from the jump in consumer price inflation has not yet dampened the housing market. However if the increases in the key elements in home affordability such as mortgage rates, construction materials cost, etc., continue to outpace the rise in median household income, the momentum the local residential real estate market could be slowed.
Q1 Market Snapshot
🏡 Housing prices continued to rise year-over-year…up 22% from 2021.
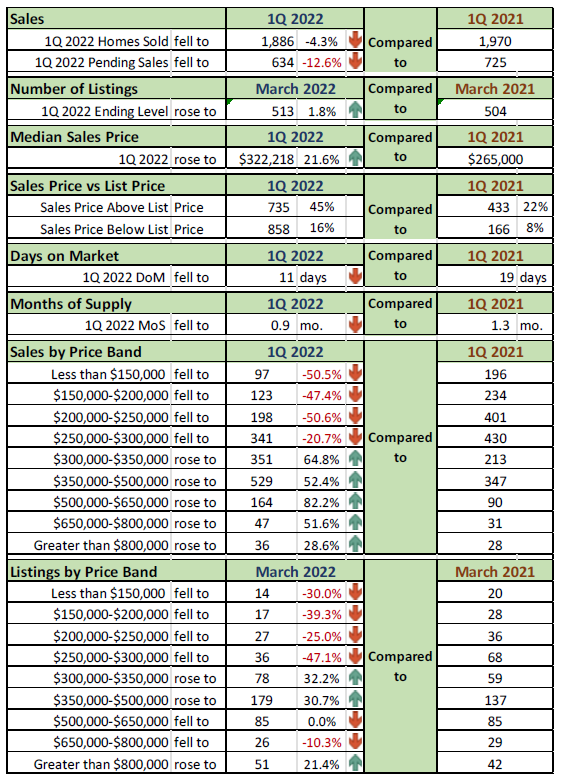
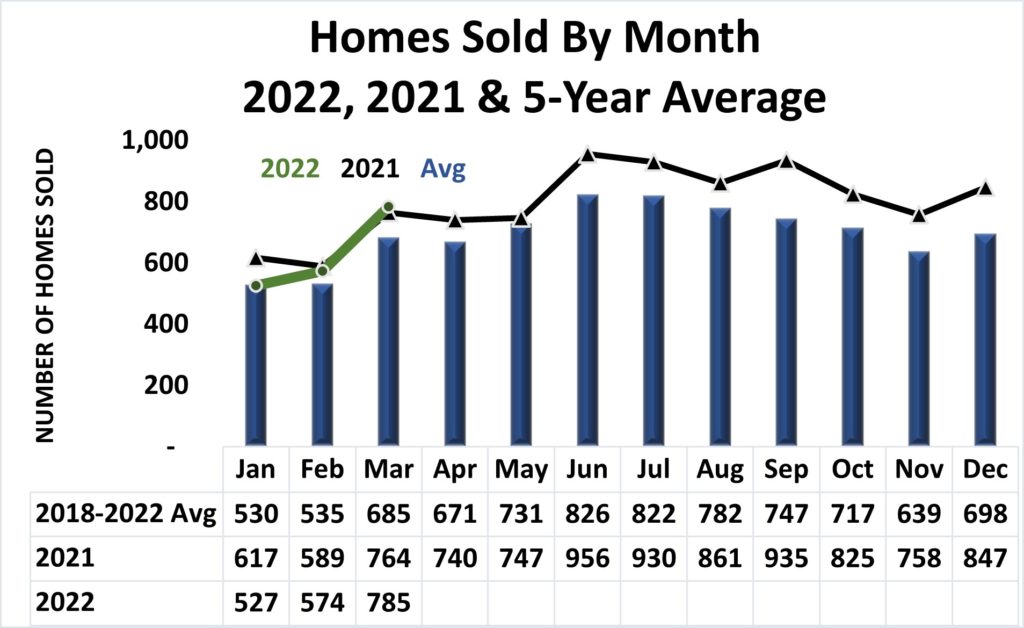
🏡 The number of homes sold fell slightly from 1Q 2021.
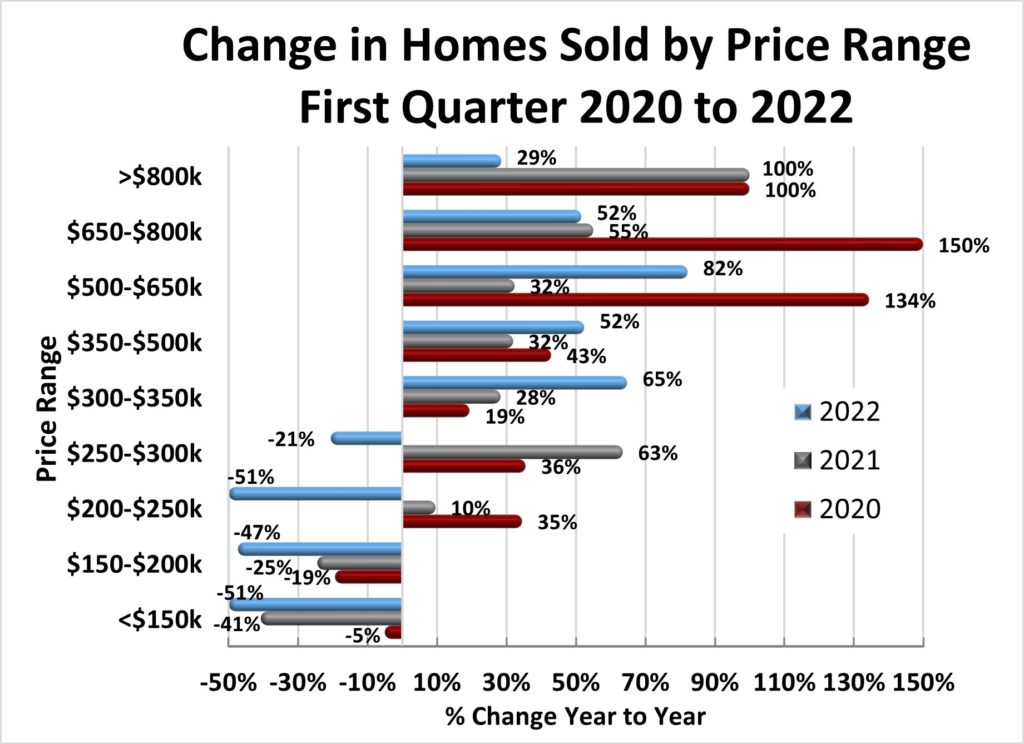
🏡 Sale of homes priced between $300,000 and $350,000 rose 65% while sales of homes priced below $150,000 dropped more than 50% compared to 1Q 2021.
🏡 Average days on market was 11 days for the quarter.
Table 1
Q1 Key Metrics
🏡 Monthly median sales prices continued to climb higher, up 21.6% from 1Q 2021.
🏡 Of the 1,886 sales in 1Q 2022, 45% sold above list price.
🏡 Number of homes sold increased from 1Q 2021 in all price bands above $300,000.
Table 2
Q1 Metrics Details
🏡 The highest level of inventory continued to be in the $350,000 and $500,000 price range.
🏡 The average months of supply for all homes fell below 1-month.
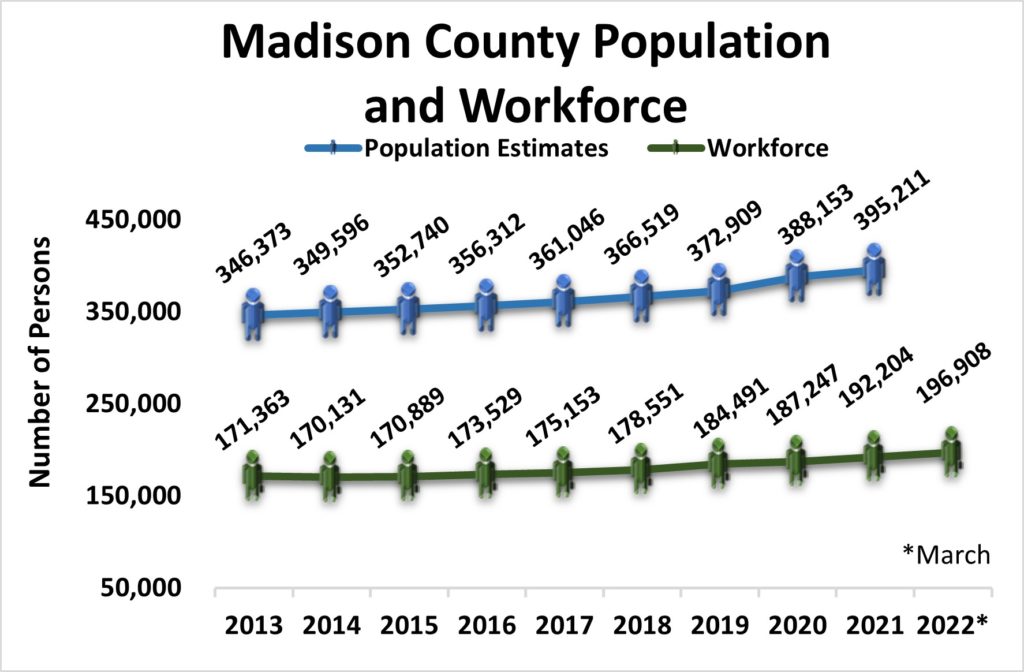
🏡 Madison County workforce grew by 2.4% from the 2021 average through March 2022. (Table 3)
🏡 Q1 increase in home prices (21.6%) outpaced the overall annual inflation rate of 8.0%. (Figure 4)
Figure 3
Figure 4
Q1 Metrics Details
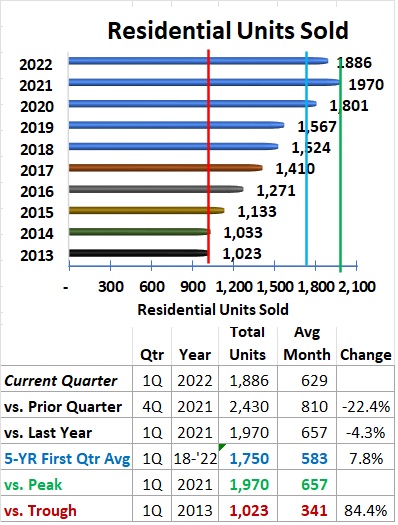
🏡 Total units sold was 1,886 which is below the 1Q 2021 record level (1,970), down significantly from 4Q 2021 (2,430) but 136 above the first-quarter 5-year average (1,750). (Figure 5)
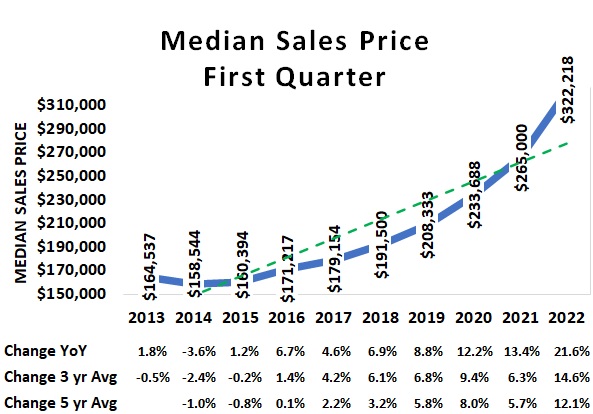
🏡 The home median sales price of the first quarter increased to $322,218, 21.6% above 1Q 2021 ($265,000). (Figure 6)
🏡 The median sales prices for January, February, and March were significantly above ($50,000, $62,000, and $61,000 respectively) the same months in 2021. (Figure 7)
Figure 5
Figure 6
Figure 7
Q1 Metrics Details
🏡 Total 1Q sales were higher than 1Q 2021 and 2020 levels for homes priced above $300,000 but were significantly below the number of 1Q units sold priced below $250,000. (Figure 8)
🏡 Sales of homes priced above $350,000 grew but at a slower level than in 1Q 2020. (Figure 9)
🏡 Total number of available homes rose slightly with the $350,000-$500,000 having the greatest increase. (Figure 10)
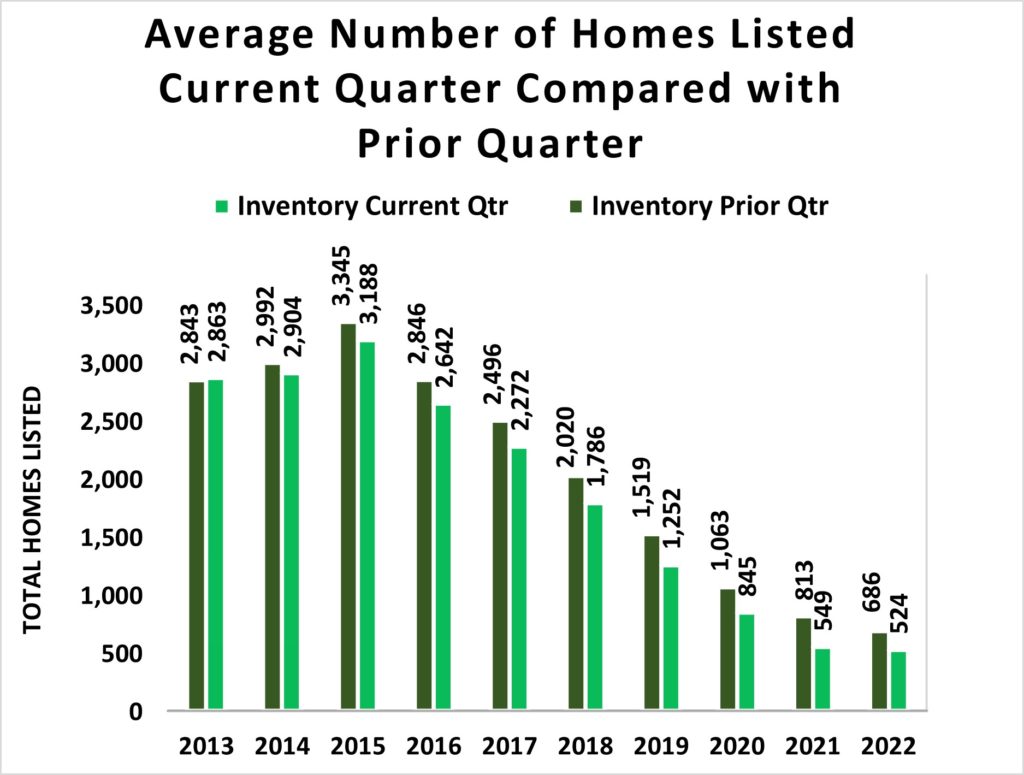
🏡 Current quarter compared to prior quarter average number of listed homes shows that the first quarter inventory has fallen each year since 2015. (Figure 11)
Figure 8
Figure 9
Figure 10
Figure 11
Q1 Metrics Details
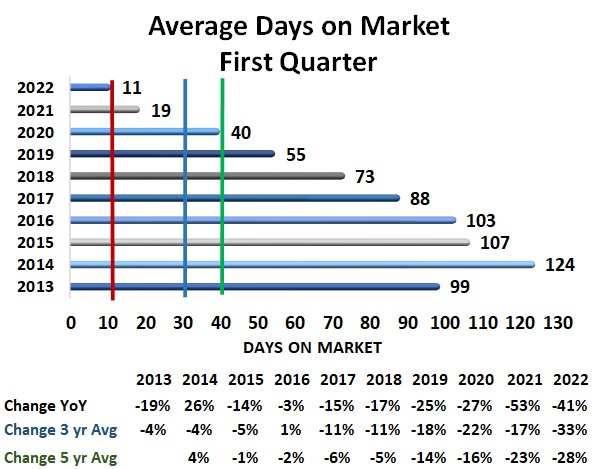
🏡 Average Days on Market fell 41% to another record low of 11 days in 1Q 2022. (Red line Figure 12)
🏡 Months of supply of homes continues at critically low levels across all price ranges. (Figure 13)
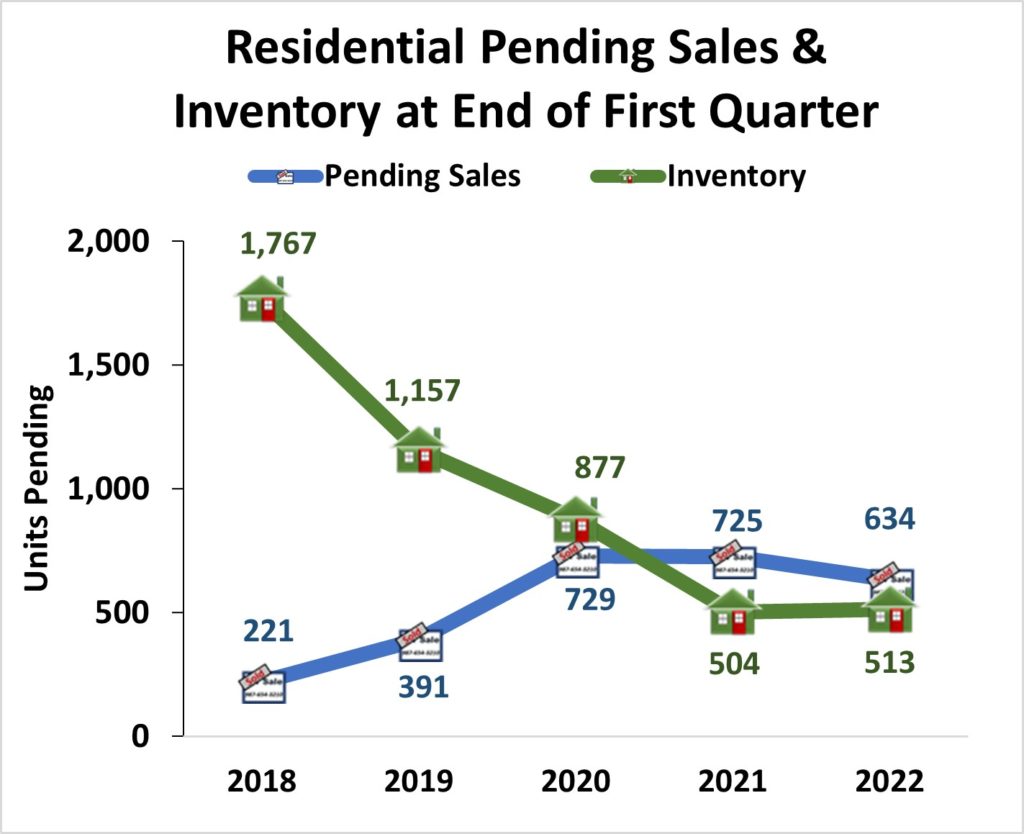
🏡 The quarterly number of homes pending sale fell significantly to 634 homes in 1Q 2022. (Figure 14)
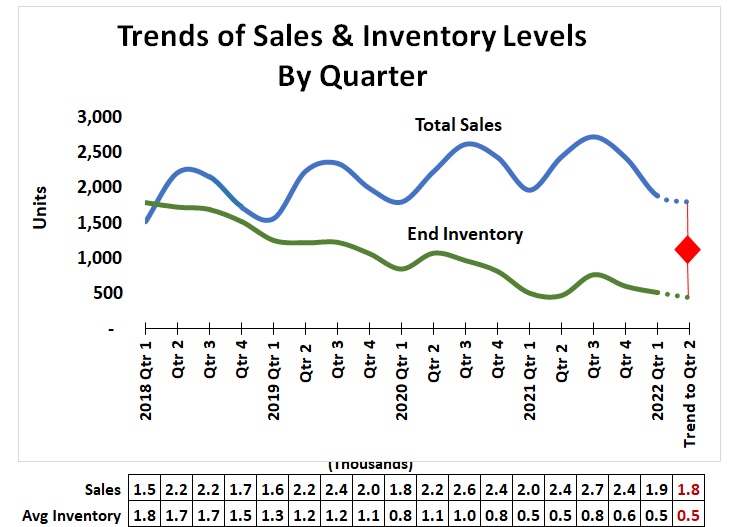
🏡 The 17-quarter trend for sales and inventory levels suggests total sales could fall to 1,800 in 2Q 2022 while the inventory of listed homes may remain around 500 units. To sustain this trend, at least 1,000 new listings (twice the 1Q ending inventory) will be needed in 2Q 2022. (Figure 15)
Figure 12
Figure 13
Figure 14
Figure 15
Madison County Economic Indicators
🏡 Madison County population grew to 395,211 in 2021. (Figure 16)
🏡 Madison County workforce reached 196,908 in March 2022. (Figure 16)
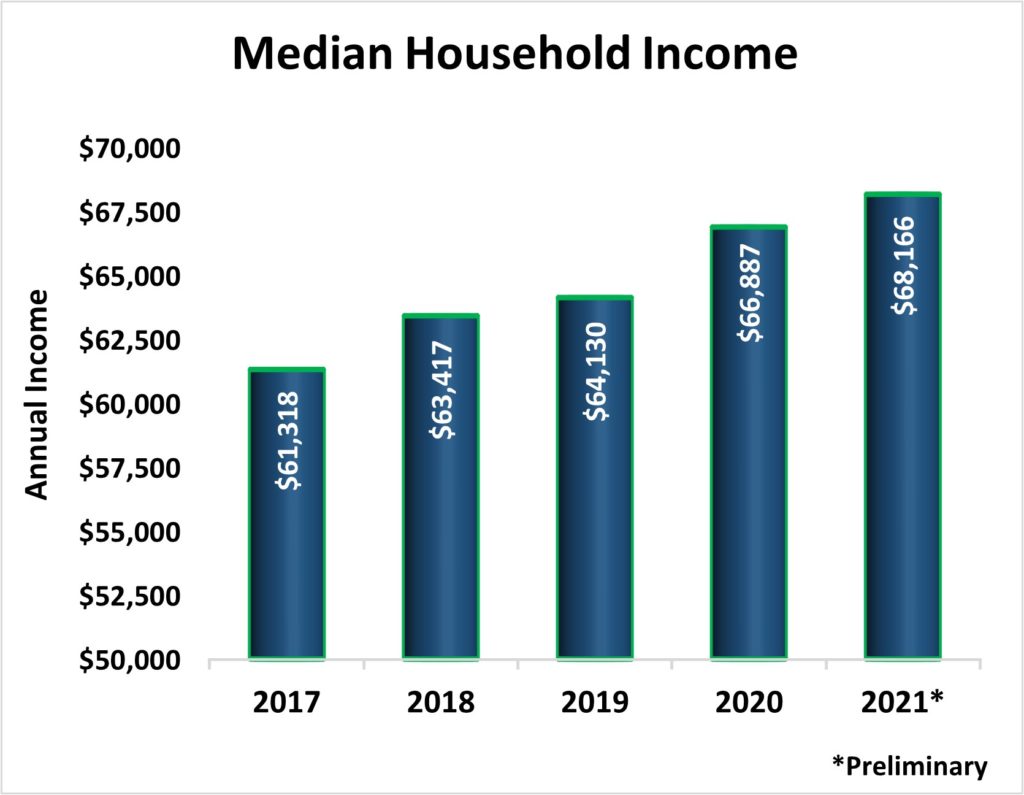
🏡 Median Household Income in Madison County rose to $68,166 in 2021…significantly above the pre-pandemic level. (Figure 17)
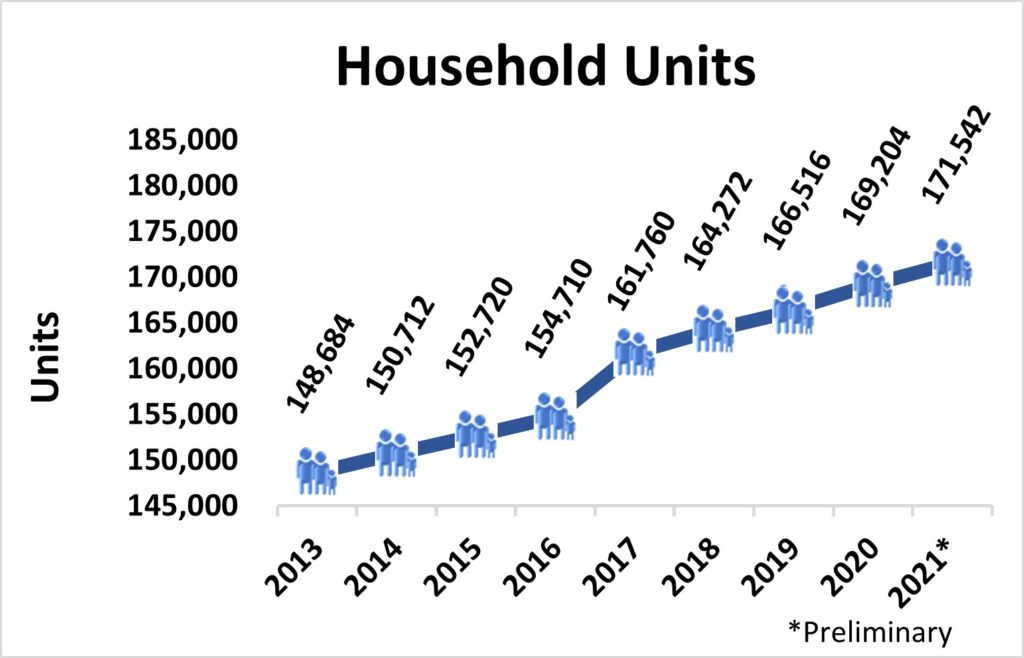
🏡 The number of household units grew to an estimated 171,542 in 2021. This represents all types of housing units comprised of nuclear families, extended families, individuals living alone as well as unrelated roommates. Housing units should generally move in relation to population trends. (Figure 18)
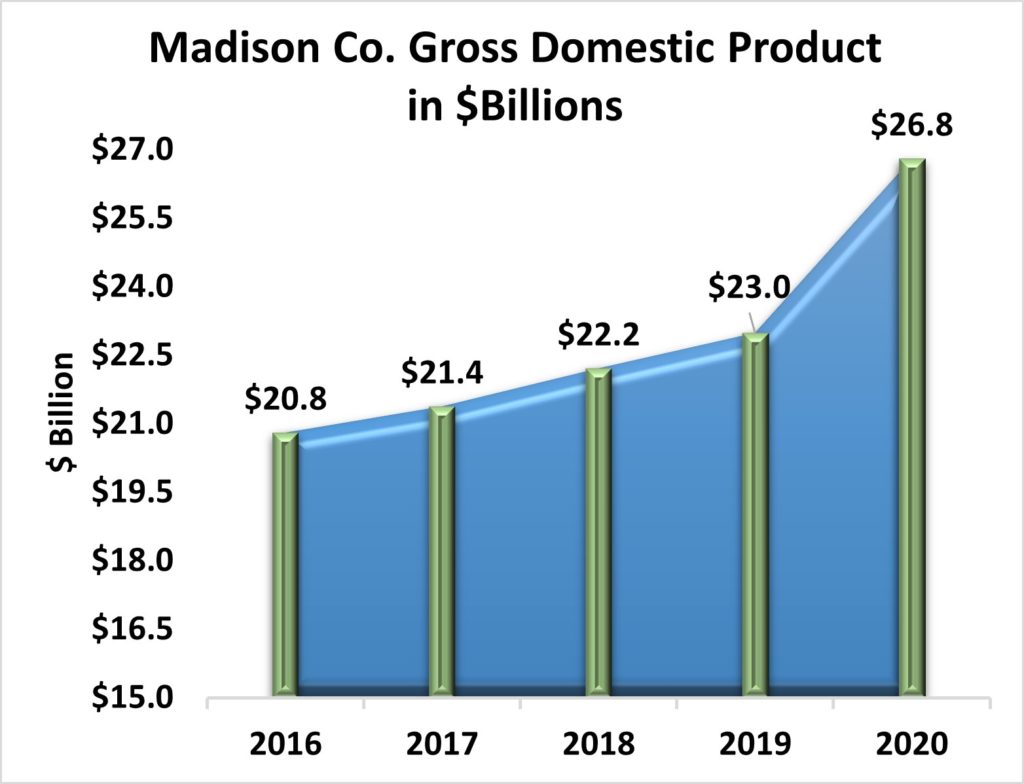
🏡 Gross Domestic Product (a monetary measure of the market value of all the final goods and services produced in a specific time period) for Madison County rose 16.5% from 2019 to an estimated $26.8 billion in 2020, the most recent estimate available. (Figure 19)
Figure 16
Figure 17
Figure 18
Figure 19
Sources & Contact
Data Sources:
Alabama Department of Labor
Huntsville Area Association of Realtors Monthly Housing Statistics Reports
U.S. Bureau of Economic Analysis
U.S. Census Bureau
Valley MLS System
Analysis & Report Prepared by:
Jeff Thompson, Project Director
Brinda Mahalingam, Ph.D., Economist
Karen Yarbrough, Editor
Questions regarding this report may be directed to:
Jeff Thompson, jeff.thompson@uah.edu, 256.361.9061