Q4 Econ Report: Historic Rise in Value, < $300k Inventory Drops 64%

2021 Q4 Insight:

  • Home prices rose to record levels with 4Q median price up 17% over 4Q 2020.
  • Inventory of homes continued to fall from 3Q 2021 and compared to 4Q 2020 levels.
  • Inventory of homes priced below $300,000 fell 64% from 4Q year over year.
  • The greatest number of listed homes at year-end was in the $300-$350,000 range.
  • Days-on-market continued from 3Q lows at around 10 days in 4Q but was half of the 4Q 2020 level.
  • There were 1,044 more homes sold in 4Q than were on the market at the beginning of 4Q.
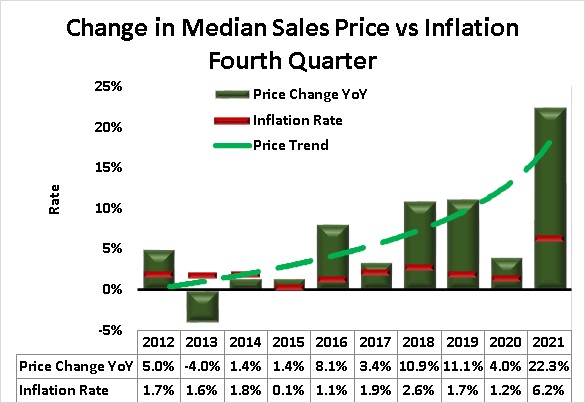
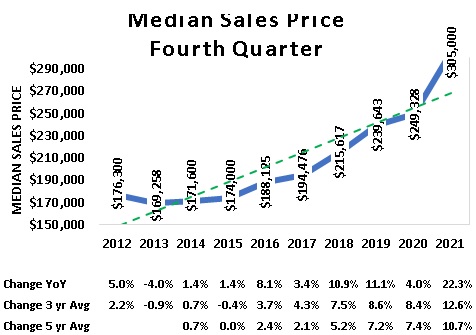
Home prices rose to record levels with the median price of $305,000 and the average price of homes sold of $332,297 in 4Q.  The green dashed line in Figure 7 shows the price trend with the green bars indicating median price by year.  Compared to the overall inflation rate (red lines), home prices are rising much faster than other components of cost of living. 
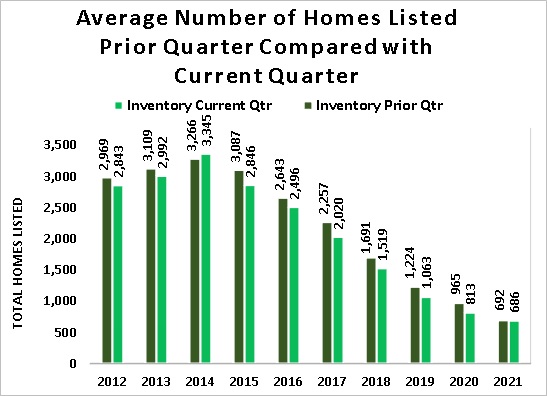
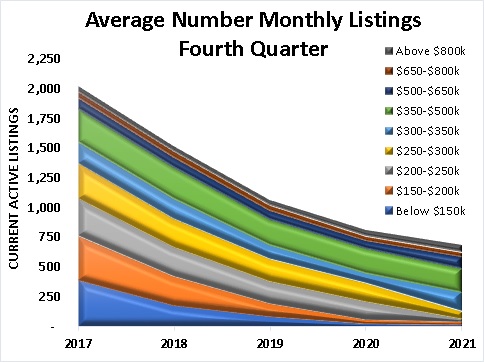
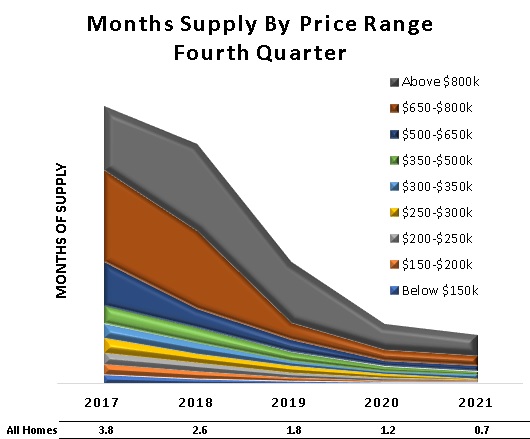
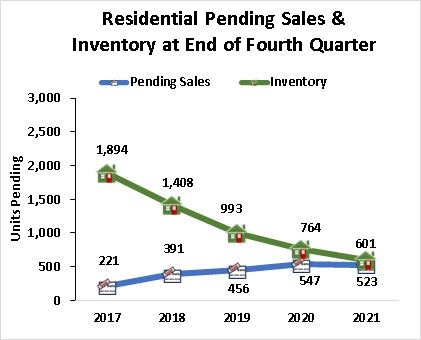
The inventory of homes listed for sale (green columns in Figure 8) show the change quarter-to-quarter in the number of homes listed and suggests that inventory levels were relatively stable for the past 6-months although at record low levels.  The availability of homes priced below $300,000 fell 67% from Dec. 2020 and 40% from Sep 2021.  December pending sales (523) was the lowest  level since October 2020.
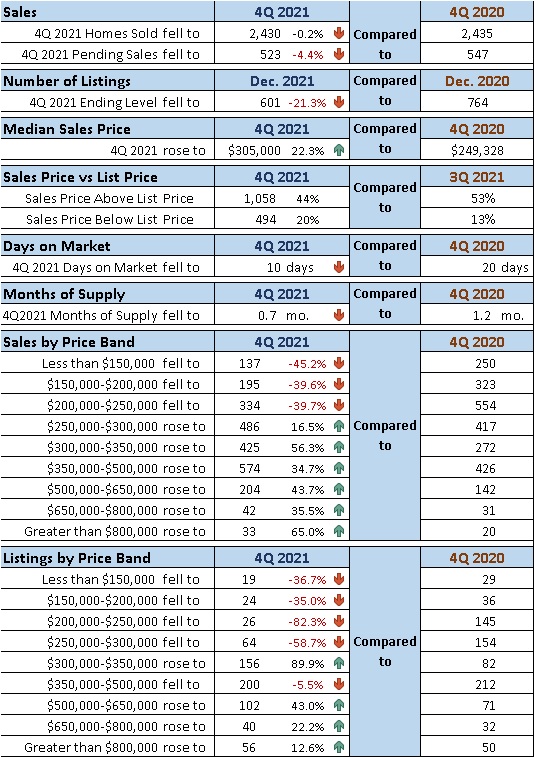
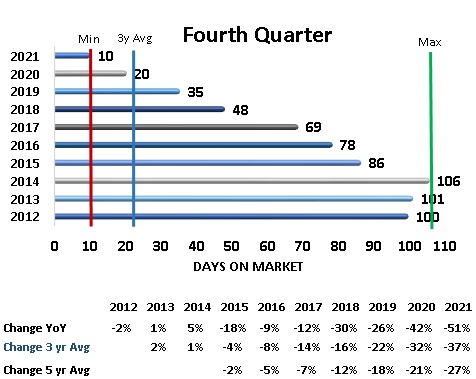
Days-on-market average for 4Q continued at the 3Q level of 10 days which is 50% below the 2020 3Q and 4Q level.  This quick turn over and record low levels of listed homes supported higher prices and encouraged new home construction.
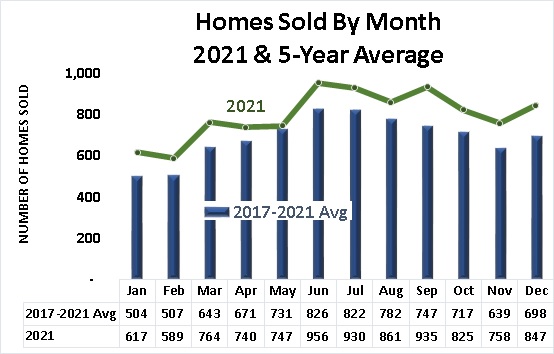
The number of newly constructed homes sold fell slightly in 4Q to 709 from the 3Q level of 723.  Given the record low of available homes, new home construction continues to be criticaly important in meeting the demand for residential real estate in Madison County.  However, changes in factors such as mortgage rates, construction materials cost, availability of rental properties, etc., could quickly influence the momentum of the residential real estate market in Madison and surrounding counties.
FIGURE 7
FIGURE 8

Q4 Market Snapshot:

  • The Madison County residential real estate market continued at record highs.
  • Median sales price 4Q rose to $305,000, an increase of more than 22% above 4Q 2020.
  • Homes sold (2,430) were only 5 below the 4Q 2020 total.
  • Number of homes available at the end of 4Q fell 21% below 3Q 2021 and 4Q 2020 (Table 2).
TABLE 2

Q4 Metrics Detail:

  • 4Q 2021 sales (2,430) were comparable to the 4Q 2020 level, above the 3Q level and 6% above the 5-year 4Q average
  • Median monthly sales price rose in each month of the quarter to an all-time high of $315,000 in Dec.
  • 80% of homes sold in 4Q 2021 had a sold price at or above the listed price.
  • 20% of homes sold for cash compared to 57% of homes financed conventionally. See Table 3.
TABLE 3
  • Home sales in all 12 months of 2021 exceeded the 5-year average monthly levels. (Figure 9)
  • Inflation surged to 6.2% for the year while home prices rose 22.3% year-over-year. (Figure 10)
  • Population growth slowed in 2020 and through the first half of 2021 (Table 4)
FIGURE 9
FIGURE 10
TABLE 4
  • Total units sold 4Q reached 2,430 which is just below the previous high of 2,435 in 3Q2020. (Figure 11)
  • The 4Q median sales price of homes sold ($305,000) experienced a record increase. (Figure 12)
  • The December median sales price set a monthly record at $ 315,000, significantly above the 2020 4Q monthly levels. (Figure 13)
FIGURE 11
FIGURE 12
FIGURE 13
  • The number of homes sold increased most in the above $250,000 price range while sales fell for homes priced below $250,000. (Figure 14)
  • The greatest percentage increase in the number of homes sold in 4Q 2021was in the above $800,000 range. In 2020, the greatest percentage increase occurred in the $500-$650,000 and in 2019, the $650-$800,000 priced homes. (Figure 16)
  • The number of homes available rose in only four price bands with the $350-$500,000 range experiencing the greatest rise (90%). (Figure 15)
  • The quarterly average number of listed homes remained extremely low at 686 but was only down six homes from the 3Q 2021 level. (Figure 11)
FIGURE 14
FIGURE 16
FIGURE 15
FIGURE 17
  • Average Days-on-Market in 4Q remained at the record low of 10 days in 2021. (Figure 18)
  • The quarterly number of homes pending sale (523) in 4Q fell from the 4Q 2020 (547). (Figure 19)
  • Months-of-supply of homes available continued to decline across most price ranges to an overall level of 0.7 months in 4Q 2021. (Figure 20)
  • The 16-quarter trend for sales and inventory levels suggests 1Q 2022 total sales could be approximately 2,460 while the inventory of available homes could fall below 500 units. However, if recent levels of new construction continue, inventory could improve and support a greater number of sales.  (Figure 21)
FIGURE 18
FIGURE 20
FIGURE 19
FIGURE 21

Madison County Economic Indicators

• The most recent estimate of Madison County population grew to 388,791 in 2021. (Figure 22)
• Madison County workforce was at 189,711 in November 2021. (Figure 22)
• Median Household Income 2020 was $68,166 (Figure 23)
• The number of household units grew to 171,542 in 2021. This represents all types of housing units comprised of nuclear families, extended families, individuals living alone as well as unrelated roommates. The number of housing units should move in relation to population trends. (Figure 24)
• Gross Domestic Product (a monetary measure of the market value of all the final goods and services produced in a specific time period) for Madison County rose to $26.8 billion in 2020, the most recent estimate available. (Figure 25)
FIGURE 22
FIGURE 24
FIGURE 23
FIGURE 25

Data Sources:

  • Alabama Department of Labor
  • Huntsville Area Association of Realtors Monthly Housing Statistics Reports
  • U.S. Bureau of Economic Analysis
  • U.S. Census Bureau
  • Valley MLS System

Analysis & Report Prepared by:

  • Jeff Thompson, Project Director
  • Brinda Mahalingam, Ph.D., Economist
  • Karen Yarbrough, Editor

Questions regarding this report may be directed to: Jeff Thompson, jeff.thompson@uah.edu, 256.361.9061