Q4 Locks in Sales, Price & Inventory Trends, Year Over Year

Residential real estate prices rose to new heights while the number of homes listed for sale fell to a new low. The 4th quarter median sales price was $249,328 compared to $239,643 for the same quarter in 2019.  The total homes sold (2,435) was 440 above the 2019 level of 1,995. The average number of listings declined 229 homes to just 764 homes at the end of 2020.  

Average Days on Market in the fourth quarter was only 20 days compared to 35 days in 2019.

Fourth Quarter 2020 metrics include:

  • Sales – 2,435 sold with 547 sales pending compared to 1,995 sales and 456 pending in 2019.
  • Median Sales Price – Climbed to $249,328 $9,685 above the 2019 fourth quarter level.
  • Inventory – Number of available homes fell in every price band.  The total of all homes available declined to 764 at the end of the 4th quarter.  There were 910 homes available at the end of September and 993 at the end of the 2019.
  • Days on Market–Was at only 20 days compared to 35 days in 2019. DOM was 16 days at end of October.
  • Months of Supply – Fell to 1.2 months from the 1.8 months in 2019.
Figure 7

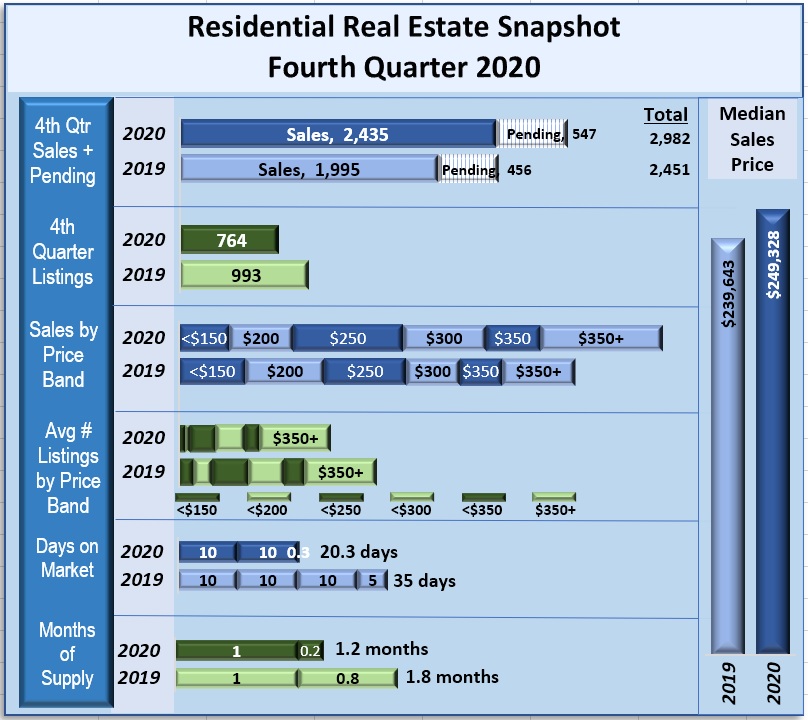
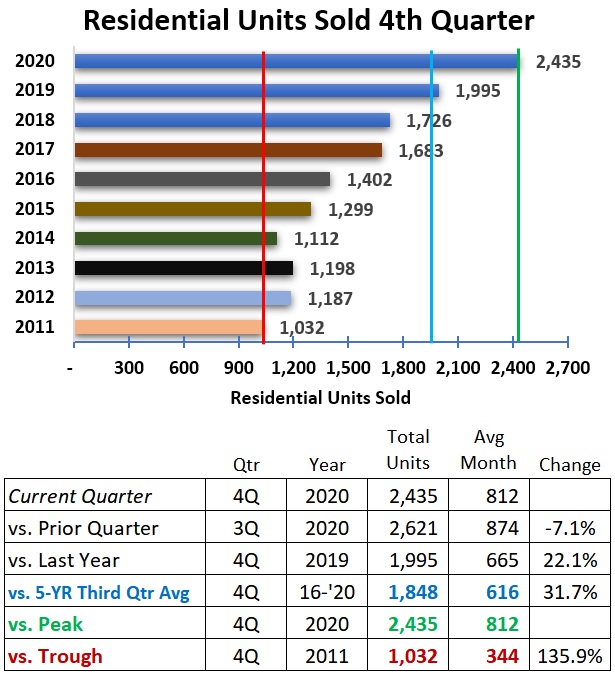
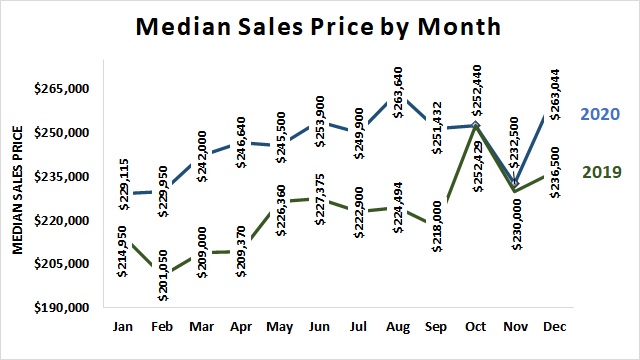
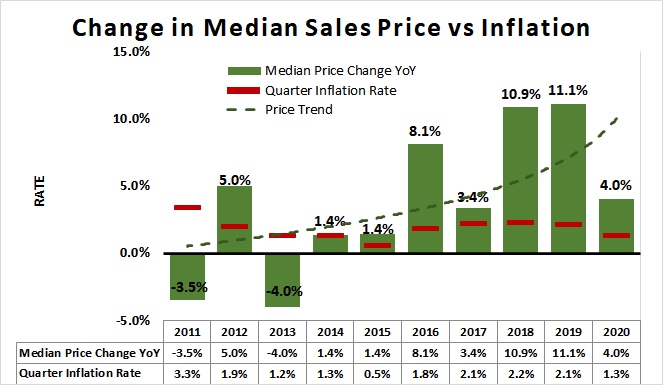
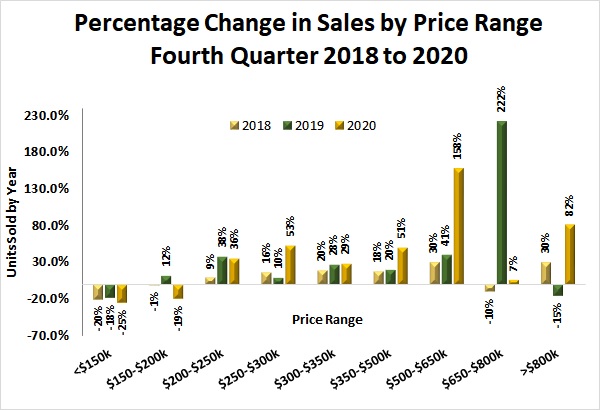
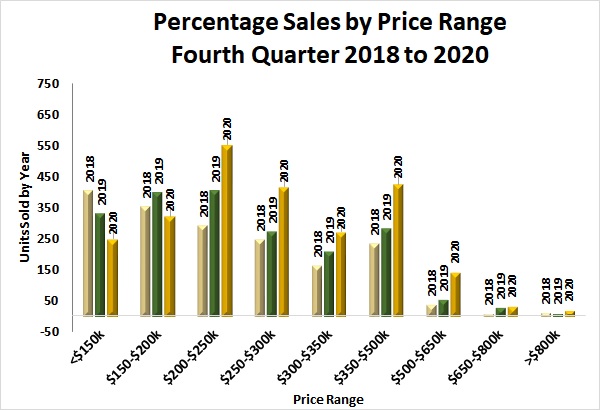
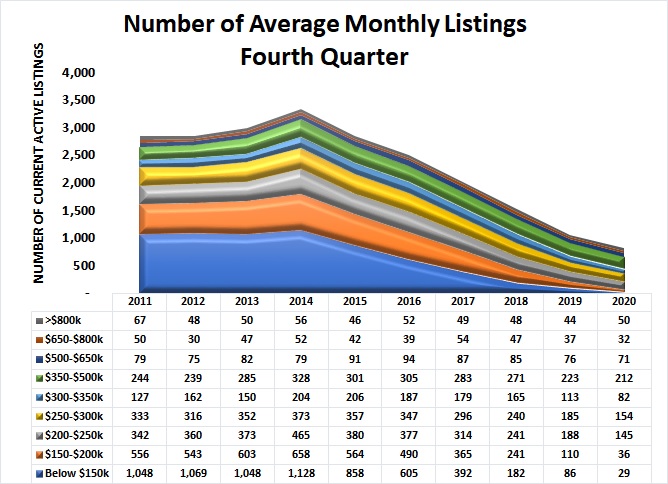
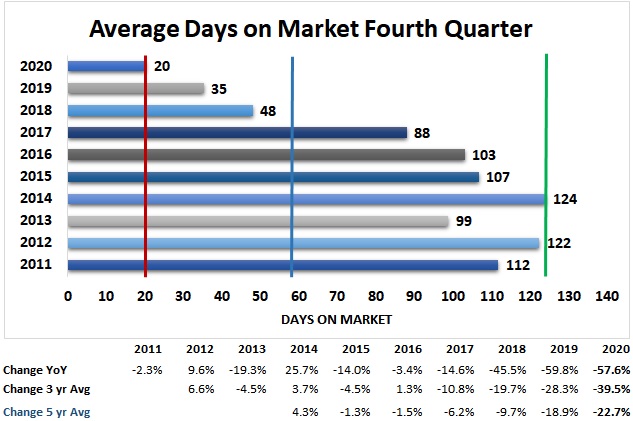
Sales Price Band:   Less than $150,000 sales fell to 286 (-38%) sales compared to 461 in 2019

  • $150,000-$200,000 sales fell to 323 (-19%) sales compared to 400 in 2019
  • $200,000-$250,000 sales rose to 554 (9%) sales compared to 509 in 2019
  • $250,000-$300,000 sales rose to 417 (53%) compared to 273 in 2019
  • $300,000-$350,000 sales rose to 272 (29%) compared to 211 in 2019
  • Over $350,000 sales rose to 619 (67%) compared to 370 in 2019

Inventory Price Band:  Less than $150,000 fell to 29 (-66%) homes vs. 86 in 2019

  • $150,000-$200,000 fell to 36 (-67%) homes vs. 110 in 2019
  • $200,000-$250,000 fell to 145 (-23% homes vs. 188 in 2019
  • $250,000-$300,000 fell to 154 (-17%) homes vs. 185 in 2019
  • $300,000-$350,000 fell to 82 (-27%) homes vs. 113 in 2019
Figure 8

Homes Sold

Sales climbed to another record level in the fourth quarter. The total units sold 2,435 this quarter was 22% higher than the 1,995 units sold in same quarter 2019 and 32% above the five-year average fourth quarter total sales of 1,848.  See Figure 8.

Homes Sold by Month

The average number of homes sold monthly in 2020 continues to exceed the five-year (2016-2020) monthly average. December’s actual sales of 867 was 38% above the five-year average December sales level (627).  November’s actual sales of 729 was 26% above the 5-year average November sales of 578. October sales (839) was 30% above the five-year average of 643. See Figure 9.

Figure 9
Figure 10

Median Sales Price

The overall price trend continued to rise in the 4th quarter 2020 as shown in Figure 10.  Figure 11 shows the median sales price by month for 2019 and 2020.    All months in 2020 saw higher prices than 2019.  

The median sales price reached a monthly peak of $263,640 in August (17% above 2019).  December’s median sales price of $263,044 was the high during the fourth quarter 2020.

Figure 11
Figure 12

Median home prices rose at a lower rate in 2020 (4%) compared to 2018 and 2019.  Year-over-year inflation rate for all goods was 1.3% in the 4th quarter 2020.  Figure 12 shows the year-over-year median prices (green columns) increased in the fourth quarter while the overall inflation rate (red lines) for 2020 was 1.3%.  The median price trend line (green dotted line) rises sharply over the past decade.  

Sales Price by Range

The greatest number of homes sold in the quarter (554) was for homes priced $200-$250,000, an increase of 36%.  However, the greatest percentage increase (222%) was in homes priced above $650- $800,000.  Sales of homes priced below $150,000 dropped -25%, the most in the fourth quarter and homes priced between $150,000 and $200,000 dropped by -19%.  See Figures 13 & 14.

Figure 13
Figure 14

Quarter-over-quarter comparisons shows the greatest number of homes sold (554) was in the $200,000 to $250,000 range.  Homes priced $350-$500,000 was second at 426 homes sold followed close by 417 homes priced between $250-$300,000.  The rise in the number of homes sold in price ranges above $200,000 and the drop in the number of homes sold below $200,000 since 2018 reflects a long-term increase in the price of homes in Madison County, Alabama.   The percentage growth in homes priced above $500,000 may also suggest a rise in the expectations for single family home features.

Inventory of Homes Available

The average number of homes listed for sale continues to fall.  An average of only 50 homes priced below $150,000 were listed in the fourth quarter 2020.  The greatest number of homes listed for sale was in the $350-$500,000 price range at 212.  The $250,000-$300,000 price range had the second most with 154 homes listed followed closely by 145 homes in the $200-250,000 price range.  See Figure 15.

Comparing the inventory of homes quarter-to-prior-quarter shows the continuous reduction in the number of homes available since 2014.  The average total number of homes available month-to-month fell by 250 this quarter. See Figure 16. There were only 813 homes available on average during the fourth quarter 2020.    

Figure 15
Figure 16
Months of Supply

The months-of-supply of homes for the fourth quarter 2020 was 1.2 months on average but only 0.3 months (9 days) for homes priced between $150-$200,000 at the fourth quarter sales level.  Homes priced below $150,000 was only slightly longer at 0.4 months. All price bands saw a reduction in the months-of-supply compared to the same period in 2019.

Months-of-Supply for all homes has fallen from a fourth quarter average of 8.5 months in 2011 to 1.2 months in 2020.  See Figure 17.


Figure 17

Total homes-not-sold (pending sales plus available inventory) at the end of the quarter continues to fall.  There were 764 homes listed on average during the fourth quarter 2020 while there were 547 home sales pending for a total of only 1,311 homes “not sold” in Madison County.  There was an increase of 91 in the number of pending sales from 2019.  See Figure 18.

Figure 18
Figure 19
Days on Market

The average number of days-on-market (DOM) dropped to a record fourth quarter low of 20 days in 2020. The reduction from the peak quarter average in 2014 of 124 days (green line) has been continuous with a reduction occurring in the fourth quarter of each year.  The five-year average days-on-market (blue vertical line) is 59 days.  See Figure 19.

Sales & Average Inventory Trends

Average inventory of homes available for sale (green line in Figure 20) continues to decline while the number of units sold (blue line) continues at a high level. To sustain this trend, a significant number of newly constructed homes and/or newly listed homes will be needed. Otherwise, demand pressure will push prices higher. Note, a sudden increase in mortgage loan rates could affect demand and prices.   

Figure 20 suggests the level of sales may slightly fall in the first quarter of 2021 from the fourth quarter level. The number of listed homes may rise slightly as more newly constructed homes come on market.  The red diamond area represents the potential gap between supply and demand for homes in the first quarter residential real estate market if current trends continue.  Note that an unexpected shock to the economy may unpredictably affect the demand for and/or supply of homes.

Figure 20

Real estate activity is subject to many forces including the number of people needing housing, their ability to purchase, and the confidence they have in the stability of their future income.  The economy of the region represented by the area’s Gross Domestic Product (GDP) may also provide insight into the future real estate industry.  

Madison County Population & Workforce Trends

Population of Madison County as estimated by the U.S. Census Bureau has grown steadily since the 2010 census.  The population in 2011 was 339,519 persons.  The most recent annual estimate of Madison County’s total population shows a 12% increase to 380,696 in 2020.  See the blue line in Figure 21.

The workforce is comprised of the number of people working plus those looking for work.  The annual average workforce (green line) rose each year from 2011 through 2019.  However, the total average workforce was down slightly in 2020 to 185,510 as a result of the pandemic response slowdown.  Changes in the number of people with jobs likely affects demand for housing in the region. 

Figure 21

It is important to note that the workforce is drawn from surrounding counties so not all new members of the workforce will be seeking housing in Madison County.

Households

The number of households represents the number of housing units of all types in the area — Madison County.  Households may be comprised of nuclear families, extended families, individuals living alone as well as housing for unrelated roommates.  Housing units should generally move in relation to population but not always at the same rate – there may be time lag.

The number of housing units in Madison County, Alabama grew from 144,339 in 2011 to an estimated 166,516 in 2019 (the most recent estimate available) per the U.S. Census Bureau.  This is an increase of 15% over the decade.  See Figure 22.

Figure 22
Figure 23
Household Income

A rule of thumb for housing affordability is that housing costs should not exceed 30% of household income suggesting that the Annual Household Income in a region could be used as a proxy for housing affordability.  The preliminary estimate for median annual household income for 2020 is $63,520.  This level is down from the 2019 peak and likely reflects the economic conditions resulting from the pandemic impacts. The Median level represents the point where one-half of the households have income above and one-half have income below the level.  Overall, the Annual Median Household Income in current dollars has grown by 10.5% since 2011.  See Figure 23.


Gross Domestic Product – Huntsville Metropolitan Statistical Area

Gross Domestic Product is the sum of all transactions for goods and services produced in the region.  The Huntsville Metropolitan Statistical Area is comprised of Limestone and Madison Counties.

Gross Domestic Product for the Huntsville MSA (Madison & Limestone Counties) grew to approximately $29.5 billion dollars in 2019, the most recent year data is available.  This is an increase of 35% since 2011.   See Figure 24.

Gross Domestic Product for the Huntsville MSA (Madison & Limestone Counties) grew to approximately $27.6 billion dollars in 2018, the most recent year data available. This is an increase of 26% since 2011. See Figure 18.

Economic Growth Developments

The Chamber of Commerce of Huntsville/ Madison County is the lead economic development organization in Madison County.  Existing industry and new industry announcements may provide insight into the economic activity in the coming year.  Recent economic development announcements can be found with this link:

Data Sources:

Alabama Department of Labor
Huntsville Area Association of Realtors Quarterly Reports
U.S. Bureau of Economic Analysis
U.S. Census Bureau
Valley MLS System

Analysis & Report Prepared by:

Jeff Thompson, Project Director
Brinda Mahalingam, Ph.D., Economist
Karen Yarbrough, Editor

Questions regarding this report should be directed to:

Jeff Thompson, jeff.thompson@uah.edu, 256.361.9065

If you would like your company’s branding placed on this report to distribute to your clients or colleagues, please email Daniela Perallon your request with a high resolution logo at Daniela@valleymls.com.