2018 Broke the Record for Home Sales, Despite 15-yr Low for Inventory
Posted on 02/07/2019
Posted on 02/07/2019
Residential real estate in Madison County experienced an amazing year in 2018 with $1.75 billion in total sales up from $1.5 billion in 2017. More than 7,600 properties were sold in an average of only 57 days-on-market. Average and median sales prices reached record levels. The average sales price increased 6.8% in 2018 and median sales price increased 8.2%. There were 7,100 listings during the year. Record sales volume in 2018 resulted in only 2.6 months of supply.
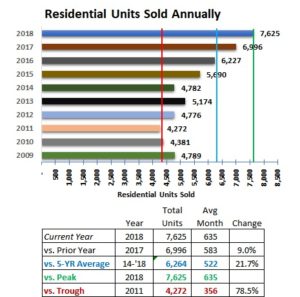
The total number of units sold in 2018 (7,625) increased 9% from 2017 and 78% from 2011, the lowest level in the past 10 years. The average number of units sold over the past five years was 6,264.
2018 brought the highest recorded median home sale price in the past decade. According the trend line analysis, if inventory of homes available for sale continues moving on a downward trend and the number of units sold continues its upward trend, we will see prices continuing to rise in 2019.
You can read the full report below or download it HERE.
I. Annual Recap 2018
Residential real estate in Madison County experienced an amazing year in 2018 with $1.75 billion in total sales up from $1.5 billion in 2017. More than 7,600 properties were sold in an average of only 57 days-on-market. Average and median sales prices reached record levels. The average sales price increased 6.8% in 2018 and median sales price increased 8.2%. There were 7,100 listings during the year. Record sales volume in 2018 resulted in only 2.6 months of supply.
Sales Volume
Sales volumes increased in each quarter of 2018 compared to the same quarter in the prior years while maintaining a normal annual seasonality. See Figure 1.
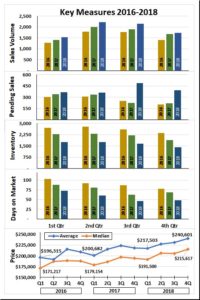
Pending Sales
Significant increases in the number of pending sales occurred in both the 3rd and 4th quarters of 2018 compared to 2017 and 2016. Quarters 1 and 2 experienced a normal level of growth.
Inventory of Homes Listed
The number of homes listed for sale declined quarter over quarter to the lowest level in more than 15 years. Days on Market The number of days-on-market declined each quarter compared to the previous year from 1st quarter 2016 through 3rd quarter 2018. The average days-onmarket were about the same during the 3rd and 4th quarters of 2018.
Prices
The average sales price (blue line) and median sales price (gold line) are trending up. The average sales price in the 4th quarter 2018 was $240,601,..an increase of 22.6% from the 1st quarter 2016. The median sales price increased 25.9% to $215,617 by the 4th quarter of 2018. Overall, the residential sales trends in both year-to-year and quarter-over-quarter comparisons climbed higher in 2018 resulting in a drop to the lowest inventory available for sale in a decade.
Units Sold
The total number of units sold in 2018 (7,625) increased 9% from 2017 and 78% from 2011, the lowest level in the past 10 years (red vertical line Figure 2). The average number of units sold over the past five years was 6,264 (blue vertical line).
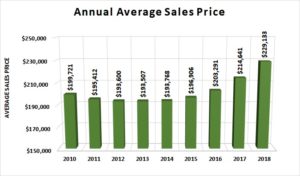
Sales Price Levels
Price levels continued to rise in 2018. The annual average sales price reached $229,133 in 2019, up 6.8% from 2017 at $214,641. Prices have edged up since 2013, the low point since 2010. Figure 3.
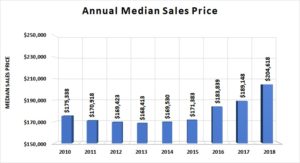
The median sales price represents the price at which 3,800 homes were sold at a lower price and 3,800 homes were sold at a higher price. Annual median levels have risen each year since 2013. The total increase over the five-year period was 21%. The 2018 median price of $204,618 increased 8% from 2017. Figure 4.
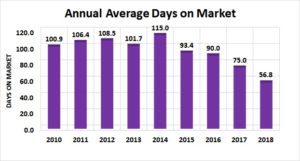
Average Days on Market
The number of days-on-market is a measure of the length of time required to sell an average property. In 2018, the average days-on-market dropped to 56.8 days, approximately half the days on market level in 2014. The magnitude of the drop suggests that demand is growing and is likely “pulling” properties on the market.
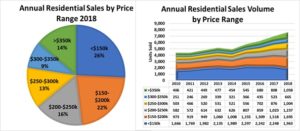
Sales by Price Range
Examining sales by property price range provides more insight into the growth of sales volume. For 2018, the largest percentage of homes sold were in the less than $150,000 at 26% of the all sales. The $150,000-$200,000 price range accounted for 22% of all homes sold. The smallest share of sales was in the $300,000-$350,000 price range at only 9% which is less than the $250,000-$300,000 price range (13%) and the range higher than 350,000 (14%).
Of the six sales price ranges shown in Figure 6, all but one range grew in total number of sales. The less than $150,000 price range declined by 13% from the 2017 sales volume but still represented the range with the largest number of units sold at 1,963. Figure 6.
Overall, 2018 was a record-breaking year for price and volume of sales. While experiences of the past are not perfect predictors of the future, residential real estate has been gaining momentum for several years. Barring a significant event, this momentum should positively impact the market at least in the near term.
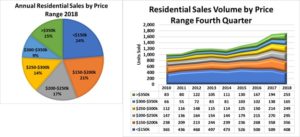
II. Fourth Quarter 2018 Overview
Record levels of home sales continued in October through December 2018. During the 4th quarter, homes priced below $150,000 continued to comprise the largest number of home sales at 408 homes or 24% of all sales. The fewest number of homes sold were in the $300,000-$350,000 price range.
Average and Median Sales Prices increased year-over-year. These price levels were higher than in any fourth quarter since at least 2010. Average Sales Price for the 4th quarter 2018 sales was $240,601. The Median Sales Price reached $215,617.
It is important to note that the number of pending sales at the end of the 4th quarter dropped significantly (19%) from the 3rd quarter 2018 but was 77% higher than the 4th quarter of 2017.
It is reasonable to expect that market momentum will continue into the 1st quarter of 2019. The relatively low inventory of homes for sale could slow sales activity as new listings from existing homes and new construction are being challenged to keep up with demand.
Homes priced below $150,000 continue to be the largest share of total sales but this range experienced a volume decline in both the 2nd and 3rd quarters of 2018. Demand pressures could be moving listings into higher price ranges at least in the short-term.
Homes priced above $350,000 continue their rise in share of all homes sold to reach 15% in the 4th quarter. See Figure 7.
III. Sales & Price Levels
Residential Sales
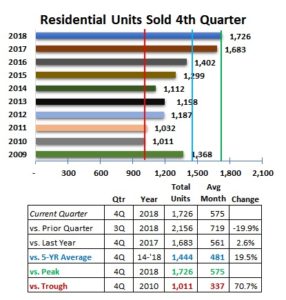
Residential home sales slowed in the 4th quarter with 1,726 homes sold vs. the 3rd quarter’s 2,156 homes sold. The 2017 4th quarter sales were only slightly lower at 1,683. The five-year average of 4th quarter sales was 1,444.
The vertical green line represents the peak level of sales between 2009 and 2018 for the 4th quarter. The blue vertical line represents the five year 4th quarter average number of sales (1,444). The red line represents the lowest number of homes sold (1,011). See Fig. 8.
Seasonality of Sales
The sales by month since 2013 peaked on average in June and then slowly dropped each month through December. See blue columns in Figure 9.
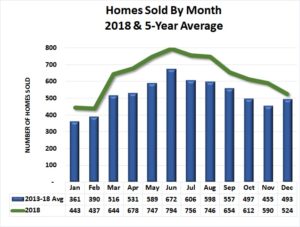
Comparing 2018 monthly sales represented by the green line in Figure 9 shows that the number of homes sold was higher than average in every month of the year.
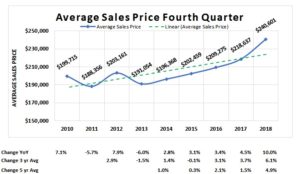
Average Sales Prices
The average sales price for all homes sold during the 4th quarter 2018 was $240,601 was up 4% from the 3rd quarter. The year-over-year average price for the 4th quarter 2018 was 10% higher than 2017. See Figure 10.
IV. Market Momentum
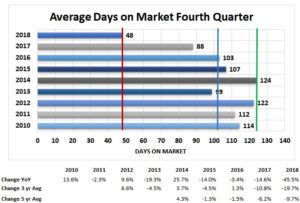
Days on Market
The average number of days-on-market (DOM) in the 4th quarter of 2018 dropped to 48 days from 88 days in 4th quarter of 2017. This is a drop of 45%, year-over-year, 19.7% of the 3-year average, and 9.7% in the 5-year average. Days-on-Market is at the lowest level for any 4th quarter since 2010. See Figure 12.
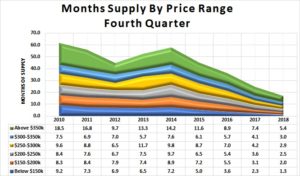
Months of Supply
Months of Supply of homes available for sale dropped again in all six price ranges. Homes with sales prices below $150,000 had the lowest available inventory at 1.3 months. The inventory of homes priced above $350,000 represents 5.4 months of sales at the 4th quarter sales level. See Figure 13.
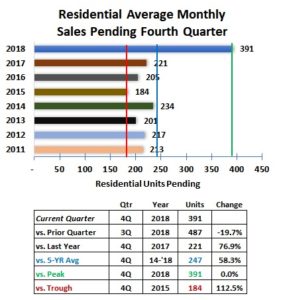
Pending Sales
At the end of the 4th quarter 2018, there were 391 sales pending to be closed, an increase of almost 20% from the end of the 3rd Quarter 2017. Compared to 4th quarter levels since 2011, this quarter’s level is 76.9% higher than 2017, 58.3% higher than the 5-year average (blue vertical line), and 112% higher than the lowest number in 2015 (red vertical line). See Figure 14.
V. Homes for Sale Inventory Status
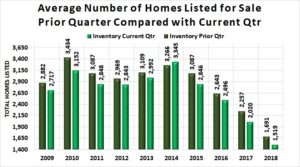
Homes for Sale The average number of residential units available for sale in the 4th quarter of 2018 decreased to 1,519 from the 3rd quarter level of 1,691. The number of homes listed for sale has declined significantly since 2009. See Figure 15.
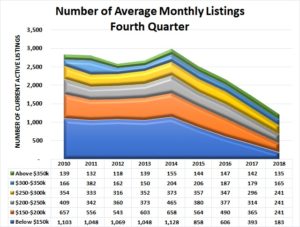
The number of homes listed for sale at December 31, 2018 dropped from the previous quarter, on September 30, 2018. The number of sales by price range in Figure 16 shows that the lowest number of homes available in the $150,000 and below range. The greatest number of homes listed at the end of the 4th quarter was 241 and found in three ranges, $150,000-200,000, $200,000-$250,000, and $250,000-$300,000.
Inventory-to-Sales Ratio
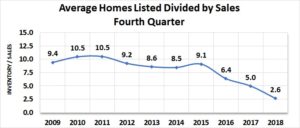
The quarterly average number of homes listed for sale (inventory) divided by the current quarterly average sales results in a metric of 2.6 houses available for sale for each house sold in the 4th quarter. This is only 25% of the level observed in 2010 and 2011. See Figure 17.
VI. Key Demographics
Real estate activity is subject to many forces including the number of people needing housing, their ability to purchase, and the confidence they have in the stability of their future income. The population, workforce, households, and economic strength of the region may provide insight into the future of the real estate industry.
Madison County Population & Workforce Trends
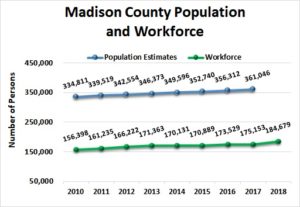
Population of Madison County as estimated by the U.S. Census Bureau has grown steadily since the 2010 census. The population in 2010 was 334,811 persons. The most recent annual estimate of Madison County’s total population shows a 7.8% increase to 361,046 in 2017 from 2010. See the blue line in Figure 18.
The workforce is comprised of the number of people working and looking for work. The annual workforce (green line) has also risen since 2010 by 18% to reach 184,679 in 2018.
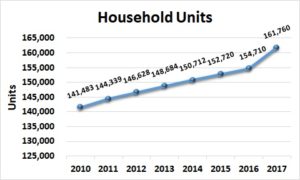
Households
The number of households represents the number of housing units of all types needed in the area, Madison County. Households may be comprised of nuclear families, extended families, individuals living alone as well as housing for unrelated roommates. Housing units should generally move in relation to population but not always at the same rate – there may be a lag.
The number of housing units in Madison County, Alabama grew from 141,483 in 2010 to an estimated 161,760 in 2017 (the most recent year data is available) per the U.S. Census Bureau. This is an increase of 14.3% over the seven-year period. See Figure 19.
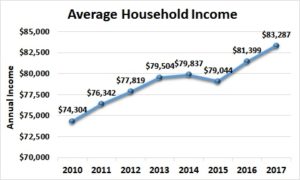
Average Household Income
The Average Household Income suggests an income level in the region that could be used to estimate housing affordability. Overall, the Annual Average Household Income in current dollars has grown significantly (9.5%) since 2010. A slight drop in 2015 more than recovered to $81,399 in 2016 and continued to rise in 2017 (the most recent year data is available). See Figure 20.
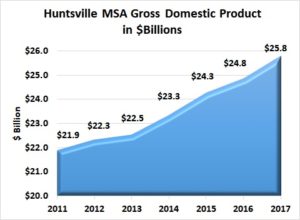
Gross Domestic Product – Huntsville Metropolitan Statistical Area
Gross Domestic Product is the sum of all goods and service transactions in the region. The Huntsville Metropolitan Statistical Area is comprised of Limestone and Madison Counties, Alabama. Gross Domestic Product for the Huntsville MSA grew by 17.8% from 2011 to 2017. GDP reached $25.8 billion dollars in 2017 (the most recent year data is available) which is a growth of 4% from 2016. See Figure 21.
VII. Local Area Outlook
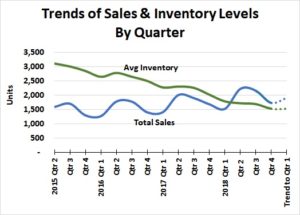
Sales & Average Inventory Trends If average inventory of homes available for sale (green line) continues its downward trend and the number of units sold (blue line) continued its upward trend, there will be pressure on prices. Figure 22 suggests that sales volume and inventory will remain relatively flat in the 1st quarter. Total sales may increases more if buyers can find (or build) homes that meet their needs. Note that a shock to the economy could occur on any given day and would affect demand for or supply of homes or both.
VIII. Other Economic Insight
Madison County Job Announcements
Economic development announcements of new and expanding industry are the result of the local community working to grow the economy. It should be noted that the number of jobs announced may be realized over several years while the new or expanded plant is built and employees are hired. The 2017 and 2018 Madison County economic development announcements include these companies.

Data Sources:
– Alabama Department of Labor
– Chamber of Commerce of Huntsville/Madison County
– Huntsville Area Association of Realtors Quarterly Reports
– U.S. Bureau of Economic Analysis
– U.S. Census Bureau
– Valley MLS System
Analysis & Report Prepared By:
– Brinda Mahalingam, Ph.D., Economist
– Jeff Thompson, Project Director
– Madeline Glosemeyer, Student Research Assistant
Questions regarding this report should be directed to:
– Jeff Thompson, jeff.thompson@uah.edu, 256.361.9065
Click HERE to download the Huntsville Area Real Estate Economics Report – Fourth Quarter