


Please note: A PDF copy of the report below can be viewed and printed HERE. If you would like your company’s branding placed on this report to distribute to your clients or colleagues, please email Daniela Perallon your request with a high resolution logo at Daniela@valleymls.com.
As the local housing market continues its upward trend for our Realtors, buyers and sellers alike, decreased inventory is a concern that we will always look to proactively guard against. There are, however, other metrics on which to focus when analyzing the state of the Real Estate industry. Home values are rising faster than the overall inflation rates. Average sales prices are up almost 11% since the third quarter of 2018. We continue to observe signs that speak to right now as being a terrific time to sell a home.
Sales and Inventory — Home sales in the 3rd quarter 2019 seasonally peaked in July and retreated in August and September. The total home sales were 2,350 for the quarter.
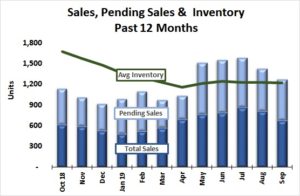 |
The September ending inventory (1,226) continued to be in the range of 2nd quarter levels. Pending sales were 595 in September, down from the 2019 peak in May at 749 homes. Total sales slowed slightly from the July height of 863 homes to 808 in August and 679 for September.
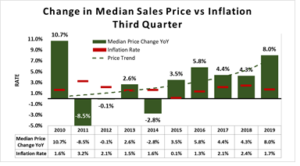 |
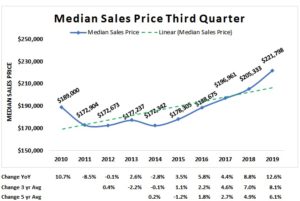
Median Sales Price — The median sales price has risen through the 3rd quarter of 2019 by 8%. The estimated inflation rate for 2019 to-date is 1.7% indicating that home values are rising faster than the overall inflation rate.
Note that there can be many reasons for changes in median sales prices such as the mix of homes sold as well as the price change of comparable homes (price inflation). Figure 2 shows the percentage change in the 3rd quarter median prices since 2010. The green dotted line represents the overall trend in 3rd quarter Median Sales Price.
The national Inflation Rate (red bar) in Figure 2 represents the increase in overall cost of living in each year. In years where the change in Median Sales Price (green column) is higher than the Inflation Rate (red bar), the increase in home prices was greater than the increase in the cost of living. The 10-year average annual inflation rate is approximately 1.8% while the average increase in median sales price for homes for the 10 years is slightly higher at 2.8%.
Change in the rise in median price versus inflation rate is not a perfect comparison, but it does show that the value of homes in Madison County have risen more than the overall cost of living and may provide insight into the price pressures of demand for and supply of houses.
Sales & Price Levels
Residential Sales
Sales of residential homes in the third quarter of 2019 grew by 112 units, an increase of 5% for the quarter. Sales were higher than the 3rd Quarter 2018 level (2,153) by 197 homes. The five-year average sales (1,976 units) increased 12.2% quarter-over-quarter from 2018 (1,760 units).
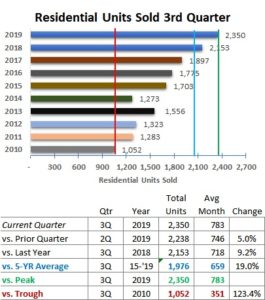 |
The vertical green line in Figure 3 represents the peak level of sales between 2010 and 2019 for 3rd quarter sales. The blue vertical line represents the five-year 3rd quarter average number of sales of 1,976. The red line represents the lowest number of homes sold at 1,052 experienced in the 3rd quarter 2010.
Seasonality of Sales
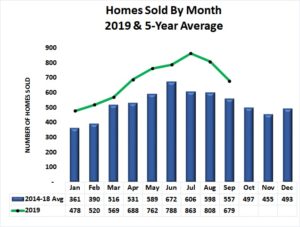 |
The sales in July, August, and September 2019 continued to be above the 5-year average levels (green line in Figure 4).
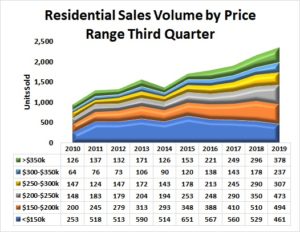
Sales Volume by Price Range
Third quarter sales volumes increased in all price bands except the two price bands below $200,000 The greatest increase in sales volume was 35% in the $200,000-$250,000 homes. Sales of homes in the $150,000-$200,000 range fell 3.1% and sales in the under $150,000 category declined by 12.9% from the 3rd quarter 2018 levels. See Figure 5.
 |
Average Sales Prices
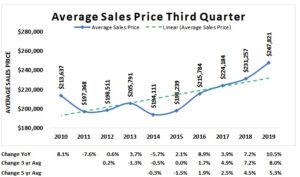 |
The average sales price for all homes sold during the 3rd Quarter 2019 rose to $247,821, an increase of 10.5% from 3rd Quarter 2018 ($231,257). The green dotted line represents the increasing average price trend since 2010. See Figure 6.
Median Sales Price
The median (midpoint) sales price in Madison County for the 3rd Quarter 2019 reached $221,798, a 12.6% increase from the 3rd Quarter 2018. The three-year average sales price grew by 8.1% and the increase in 3-year median price was 8.1%. The green dotted line represents the increasing trend in median sales prices since 2010. See Figure 7.
 |
Market Momentum
Days on Market
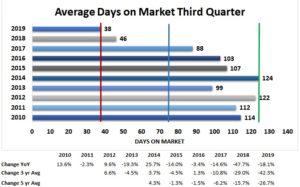 |
The average number of days on the market (DOM) in the 3rd Quarter 2019 dropped to 38 days, the lowest days on market (red line) of any 3rd Quarter since 2010. This is a drop of 18.1% from 2018 and down 42.3% since 2017. The highest number of days on market occurred in 2014 (green line). The five-year average DOM is at 76 days (blue line). See Figure 8.
Months of Supply
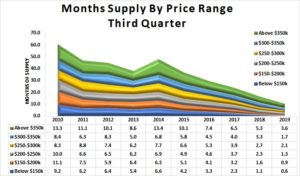 |
Months of Supply of homes available for sale continued to drop in all price bands. Homes in the sales prices below $150,000 has the lowest available inventory at 0.6 months (18 days); only slightly lower than the 0.9 months for the $150,000-$200,000 price range. See Figure 9.
Pending Sales
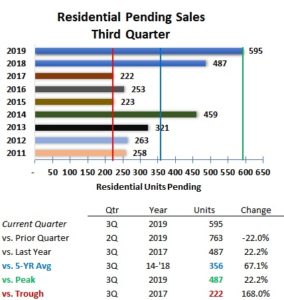 |
Pending Sales at the end of the 3rd Quarter 2019 were 595, an increase of 22% from the 3rd Quarter 2018 level. The lowest level (red vertical line) of 3rd Quarter sales pending occurred in 2017 with 222 sales pending. The five-year average number of sales pending at quarter-end (blue vertical line) for 3rd Quarter was 356 units. See Figure 10.
Homes for Sale Inventory Status
Homes for Sale
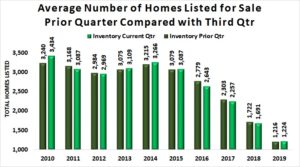 |
The average number of residential units listed for sale during the 3rd Quarter 2019 was 1,216 units, slightly down by 8 homes from the 2nd Quarter 2018 average See Figure 11.
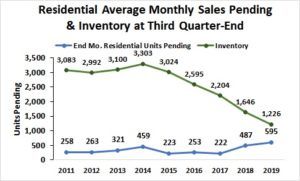 |
The number of homes listed for sale (green line) in Figure 12 at September 30, 2019 dropped 25% from September 30, 2018. The number of sales pending (blue line) increased by 22% from the third quarter 2018 setting a new high since 2010. See Figure 12.
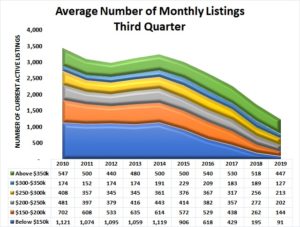
Figure 13 shows the average number of listings by price range for each 3rd Quarter since 2010. Overall the number of homes listed for sale declined by 28% from last year. The price band with the greatest decrease in the average number of homes listed for sale between 2018 and 2019 was the Below $150,000 range (53%) compared to the 50% drop in the 2nd Quarter.
 |
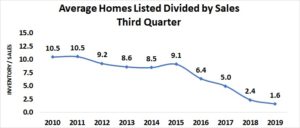
Inventory-to-Sales Ratio
The quarterly average number of homes listed for sale (inventory) divided by the current quarterly average sales results in a metric of 1.6 homes listed for each house sold in the 3rd Quarter…continuing the drop since 2011. See Figure 14.
 |
Key Demographics
Real estate activity is subject to many forces including the number of people needing housing, their ability to purchase, and the confidence they have in the stability of their future income. The economic strength of the region represented by the area’s Gross Domestic Product (GDP) may also provide insight into the future of the real estate industry.
Madison County Population & Workforce Trends
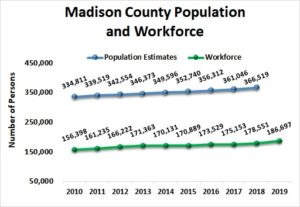 |
Population of Madison County as estimated by the U.S. Census Bureau has grown rapidly since the 2010 census. The population in 2010 was 334,811 persons. The most recent annual estimate of Madison County’s total population shows a 9.5% increase to 366,519 in 2018 from 2010. See the blue line in Figure 15.
The workforce is comprised of the number of people working and looking for work. The annual workforce (green line) has also risen since 2010 by 18.7% to reach 186,697 in June 2019.
Households
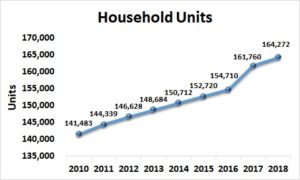 |
The number of households represents the number of housing units of all types needed in the Madison County area. Households may be comprised of nuclear families, extended families, individuals living alone as well as housing for unrelated roommates. Housing units should generally move in relation to population, but not always at the same rate – there may be lag.
The number of housing units in Madison County, Alabama grew from 141,483 in 2010 to an estimated 164,272 in 2018 (the most recent year data is available) per the U.S. Census Bureau. This is an increase of 16.1% over the eight-year period. See Figure 16.
Average Household Income
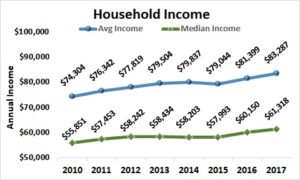 |
The Annual Household Income suggests a level of resources in the region and could be used to estimate housing affordability. The median annual household income for 2017 (most recent data) was $83,287 compared to the average annual household income of $61,318. The Median level represents the point where one-half of the households have income above, and one-half have income below the level. Overall, the Annual Median Household Income in current dollars has grown by 9.8% since 2010 compared to a 12.1% growth in Average Annual Household Income. See Figure 17.
Gross Domestic Product – Huntsville Metropolitan Statistical Area
Gross Domestic Product is the sum of all goods and services produced in the region. The Huntsville Metropolitan Statistical Area is comprised of Limestone and Madison Counties, Alabama.
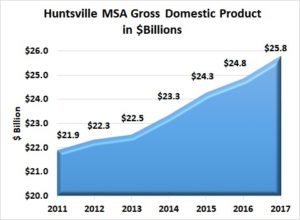 |
Gross Domestic Product for the Huntsville MSA grew by 17.8% from 2011 to 2017. Gross Domestic Product reached $25.8 billion dollars in 2017 (the most recent year data is available), which is a growth of 4% from 2016. See Figure 18.
Local Area Outlook
Sales & Average Inventory Trends
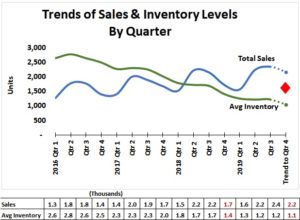
Average inventory of homes available for sale (solid green line in Figure 19) continues its downward trend and the number of units sold (solid blue line) continues its upward trend. As the gap (red diamond) between average inventory and sales widens, there will be upward pressure on prices.
Figure 19 suggests that there is downward pressure on sales as the inventory levels continue to fall. A simple growth trend calculation (dotted lines) suggests that sales could drop to approximately 2,200 units resulting in a lower level of inventory at 1,100 properties if the current trends in sales and listings continue. It is important to note that short or long-term shocks to the economy at the local or national level could affect housing supply and/or demand.
 |
Other Economic Insight
Madison County Job Announcements
Economic development announcements of new and expanding industry are the result of the local community working to grow the economy. It should be noted that the number of jobs announced may be realized over several years while the new or expanded plant is built and employees are hired. The economic development announcements for 2018 and 2019 through September in Madison County including the City of Huntsville areas in Limestone County are shown in Figure 20. For more information on these announcements, visit:
www.hsvchamber.org/departments/economic-development/economic-development-highlights
Data Sources:
- Alabama Department of Labor
- Chamber of Commerce of Huntsville/Madison County
- Huntsville Area Association of Realtors Quarterly Reports
- S. Bureau of Economic Analysis
- S. Census Bureau
- Valley MLS System
Analysis & Report Prepared By:
- Brinda Mahalingam, Ph.D., Economist
- Jeff Thompson, Project Director
Questions regarding this report should be directed to:
Jeff Thompson, jeff.thompson@uah.edu, 256.361.9065