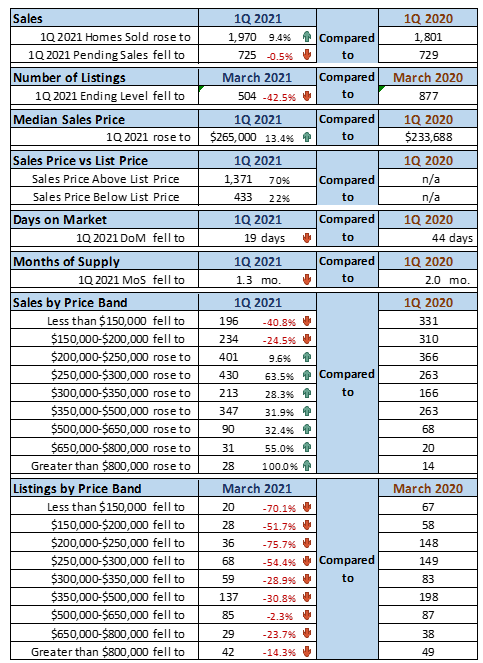
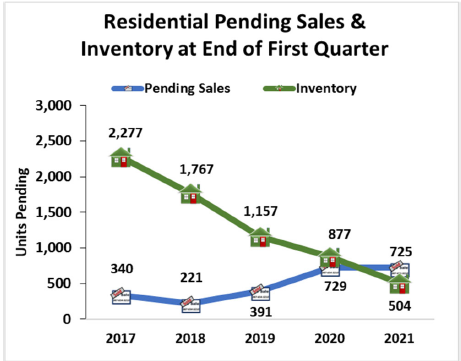
The new year saw home sales momentum continue to outpace growth in the inventory of listed homes. Demand for homes relative to the number of listed (supply) homes increased pressure on prices resulting in a record level for the median sales price at $271,825 in March 2021. The pace of sales left only 504 listed homes on March 31, 2021 compared to 877 in March 2020.
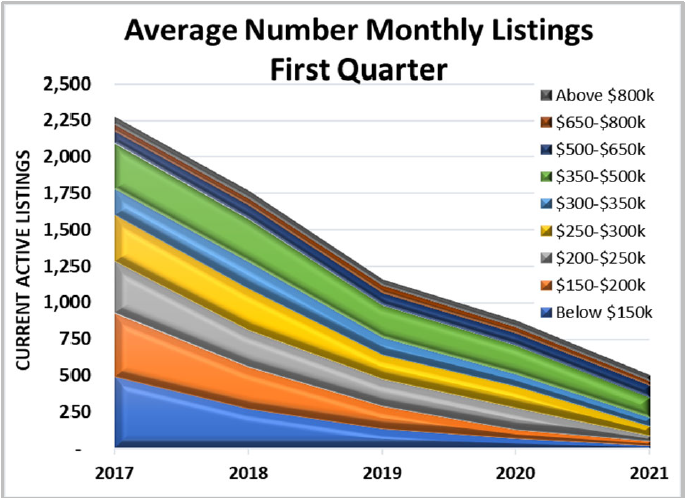
The number of listed homes has remained below 1,000 for eight consecutive months. Homes priced between $200,000-$250,000 fell by 76% in 1Q 2021 compared to 1Q 2020. Homes priced below $150,000 fell by 70%. In fact, the number of available homes in every price range in March 2021 was below the March 2020 level. See Figure 1.
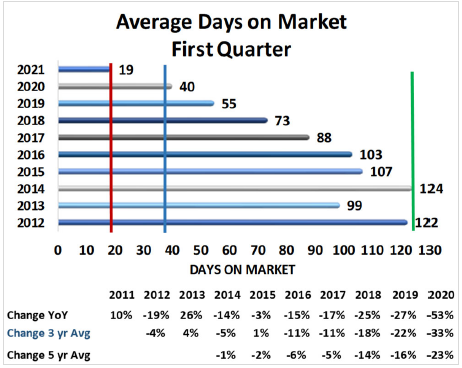
The Days-on-Market dropped to 18 days in January and March with the quarter average of 19 days on market in 1Q 2021, the lowest level for more than a decade.
Figure 1
Figure 2
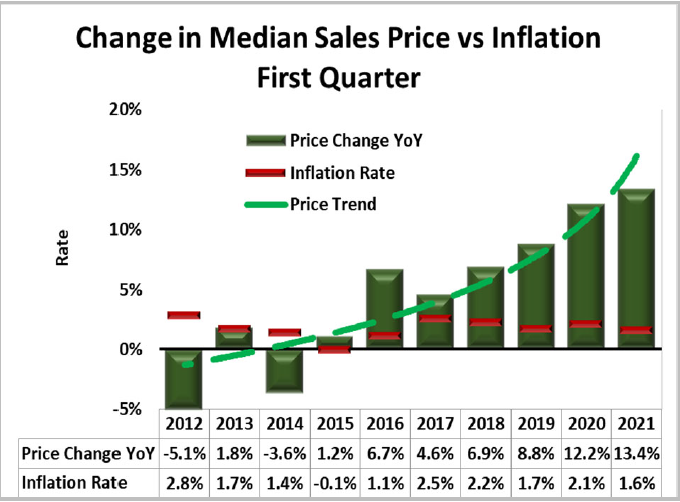
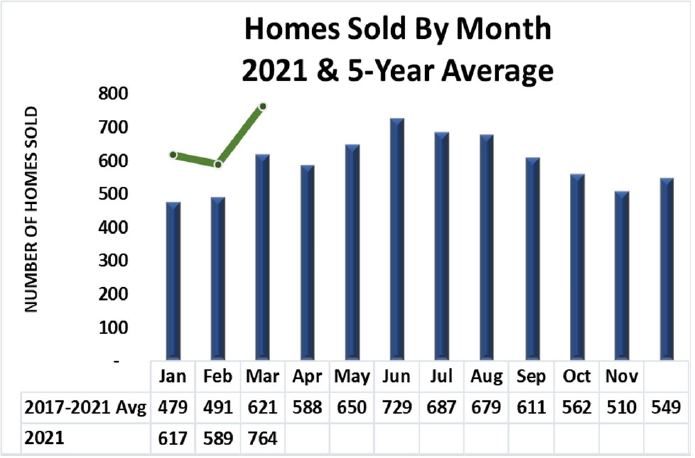
The price of homes continues to rise (green dashed line in Figure 2) faster than most other consumer spending categories. The change in costs incurred by households is reflected in the overall inflation rate. Home prices (green columns in Figure 2) in the 1Q have risen year-over-year since 2014 and the rate of increase grew to 13.4% in 2021. The inflation rate for all goods and services (red lines in Figure 2) has fluctuated during the same period and was estimated at an annual rate of 1.6% in February 2021.
In short, the residential real estate market in Madison County continues to grow faster in volume of units as well as in sales price than the availability of homes. Barring changes in any of a number of influential factors such as mortgage rates, employment levels, construction materials cost, etc., the momentum of the residential real estate market could continue until “there is nothing to sell”.
1Q 2021 Market Snapshot
The Madison County residential real estate market continued to rise in volume and price.
The median sales price rose to $265,000 this quarter, an increase of more than 13%.
The number of homes priced below $150,000 dropped 41% compared to 1Q 2020 while sale of homes priced above $800,000 doubled.
Listings of homes fell in all price bands compared to Q1 2020 led by a 75% drop in homes priced between $200,00 – $250,000. (Table 1)
Table 1
1Q 2021 Key Metrics
2021 quarter sales were at a first quarter record setting level.
The first quarter median price rose 13% above 1Q 2020.
1,129 buyers used conventional mortgage financing and 350 buyers paid cash. (Table 2)
Table 2
Figure 3
Figure 4
1Q Metrics Details
The number of listed homes fell in all price ranges led by a 76% drop in the $200,000-$250,000 range.
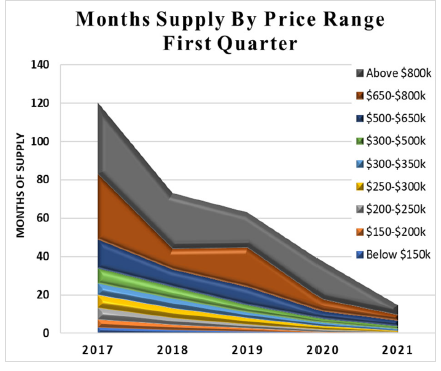
The months of supply fell below 1-month for all homes priced below $350,000.
The workforce in Madison County continued to grow despite the pandemic interruption. (Table 3)
The increase in home prices (13%) outpaced the overall inflation rate of 1.6% between 2020 – 2021. (Figure 4)
1Q Metrics Details, continued
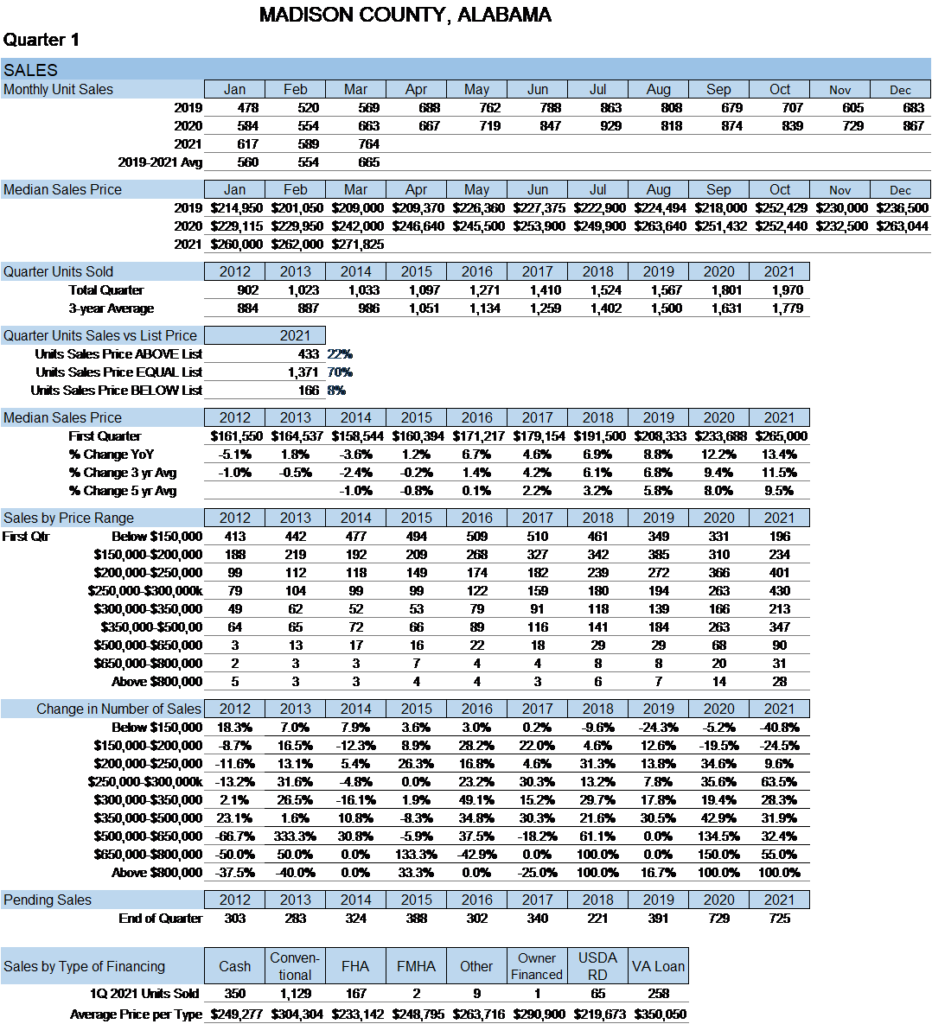
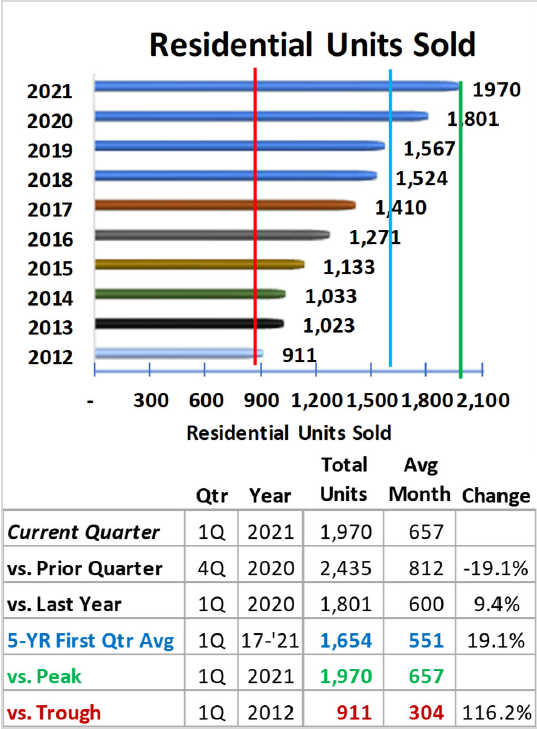
Total units sold reached 1,970, a record level in 1Q 2021, but was down from 2,435 in 4Q 2020 and 316 above the first-quarter 5-year average (1,654). (Figure 5)
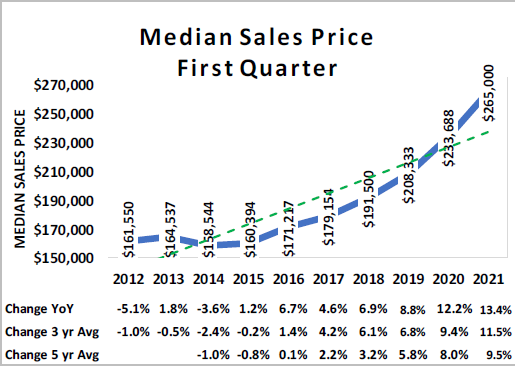
The median sales price of the first quarter increased to $265,000, 13% above the 1Q 2020 of $233,688. (Figure 6)
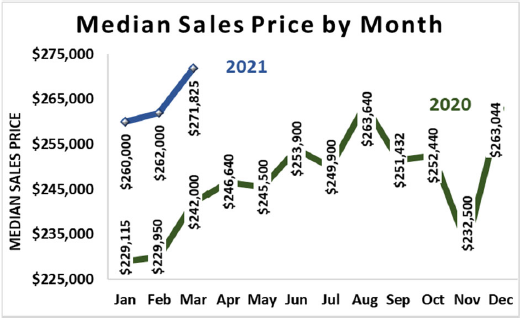
The median sales prices for January, February, and March were significantly (around $30,000) above the same months in 2020. (Figure 7)
Figure 5
Figure 6
Figure 7
1Q Metrics Details, continued
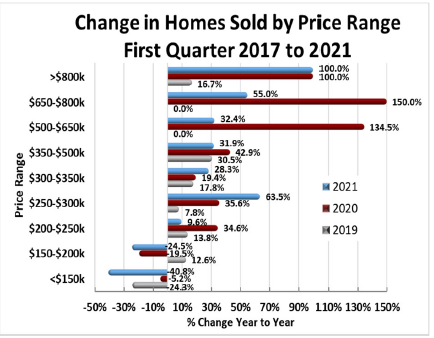
Total 1Q unit sales were above the 1Q 2020 and 2019 levels for homes priced above $200,000 but were significantly under the number of units sold priced below $200,000. (Figure 8)
Homes sold priced above $500,000 doubled while homes priced below $200,000 fell compared to 1Q 2019 and 1Q 2020. (Figure 9)
Listing of available homes continues to decline in all price ranges reaching a record total low of 504 units at the end of March 2021. (Figure 10)
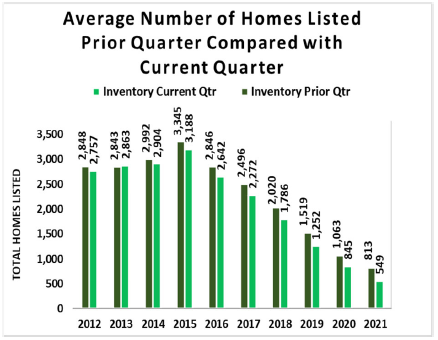
The quarterly average number of listed homes has continuously fallen quarter-to-quarter since 2014. (Figure 11)
Figure 8
Figure 9
Figure 10
Figure 11
1Q Metrics Details, continued
Average Days on Market fell 53% to another record low of 19 days in 1Q 2021. (Figure 12)
Months of supply of homes available continues to decline across all price ranges. (Figure 13)
The quarterly number of homes pending sale exceeded the number of homes listed at quarter-end for the first time in 1Q 2021. (Figure 14)
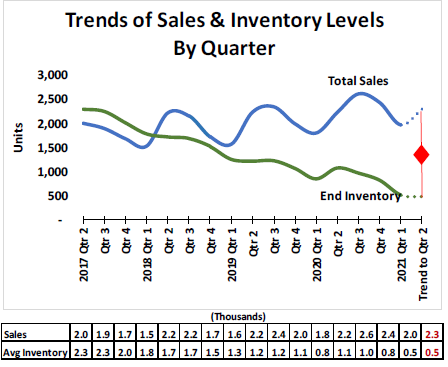
The 16-quarter trend for sales and inventory levels suggests total sales could rise to 2,300 in 2Q 2021 while the inventory of listed homes could remain around 500 units. To sustain the trend, at least 1,000 new listings (2 times the 1Q ending inventory) will be needed in 2Q. (Figure 15)
Figure 12
Figure 13
Figure 14
Figure 15
Madison County Economic Indicators
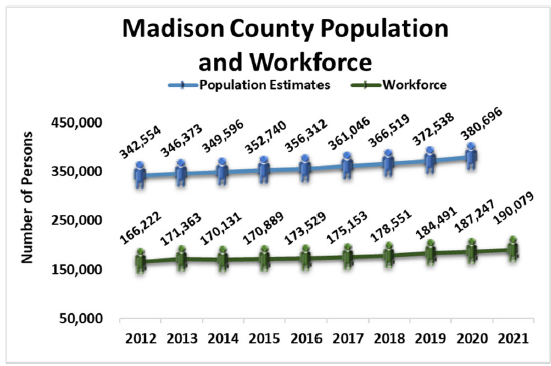
The most recent estimate of Madison County population grew to 380,700 in 2020. (Figure 16)
Madison County workforce grew to 190,000 through February 2021. (Figure 16)
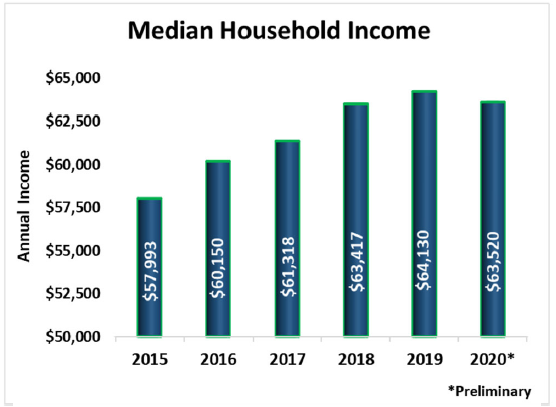
Median Household Income fell in 2020 to $63,520 mostly due to the economic slowdown caused by the pandemic response. (Figure 17)
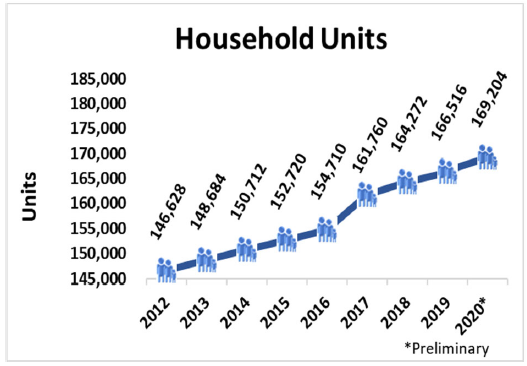
The number of household units grew to 169,204 in 2020. This represents all types of housing units comprised of nuclear families, extended families, individuals living alone as well as unrelated roommates. Housing units should generally move in relation to population trends. (Figure 18)
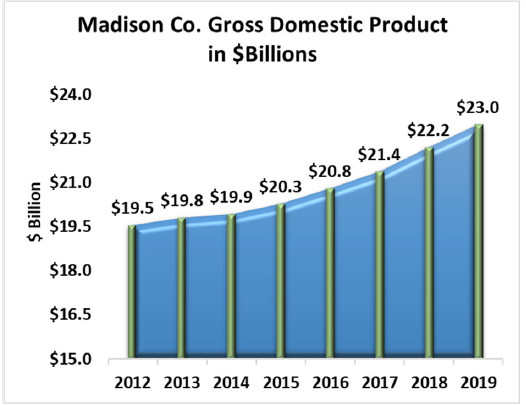
Gross Domestic Product (a monetary measure of the market value of all the final goods and services produced in a specific time period) for Madison County rose 3.6% from 2018 to $23 billion in 2019, the most recent estimate available. (Figure 19)
Figure 16
Figure 17
Figure 18
Figure 19
Analysis & Report Prepared by:
Jeff Thompson, Project Director
Brinda Mahalingam, Ph.D., Economist
Karen Yarbrough, Editor
Questions regarding this report may be directed to: Jeff Thompson, jeff.thompson@uah.edu, 256.361.9061
Data Sources:
Alabama Department of Labor
Huntsville/Madison County Chamber of Commerce www.hsvchamber.org/departments/economic-development/economic-development-highlights/
Huntsville Area Association of Realtors Monthly Housing Statistics Reports